Late Arriving Data Pipeline: Watermarks, Lateness, and Restatement
Yesterday's total changed because late events arrived. Choose a restate, reconcile, or ignore policy, then set watermarks and lookbacks.
Azeem Subhani · · 10 min read
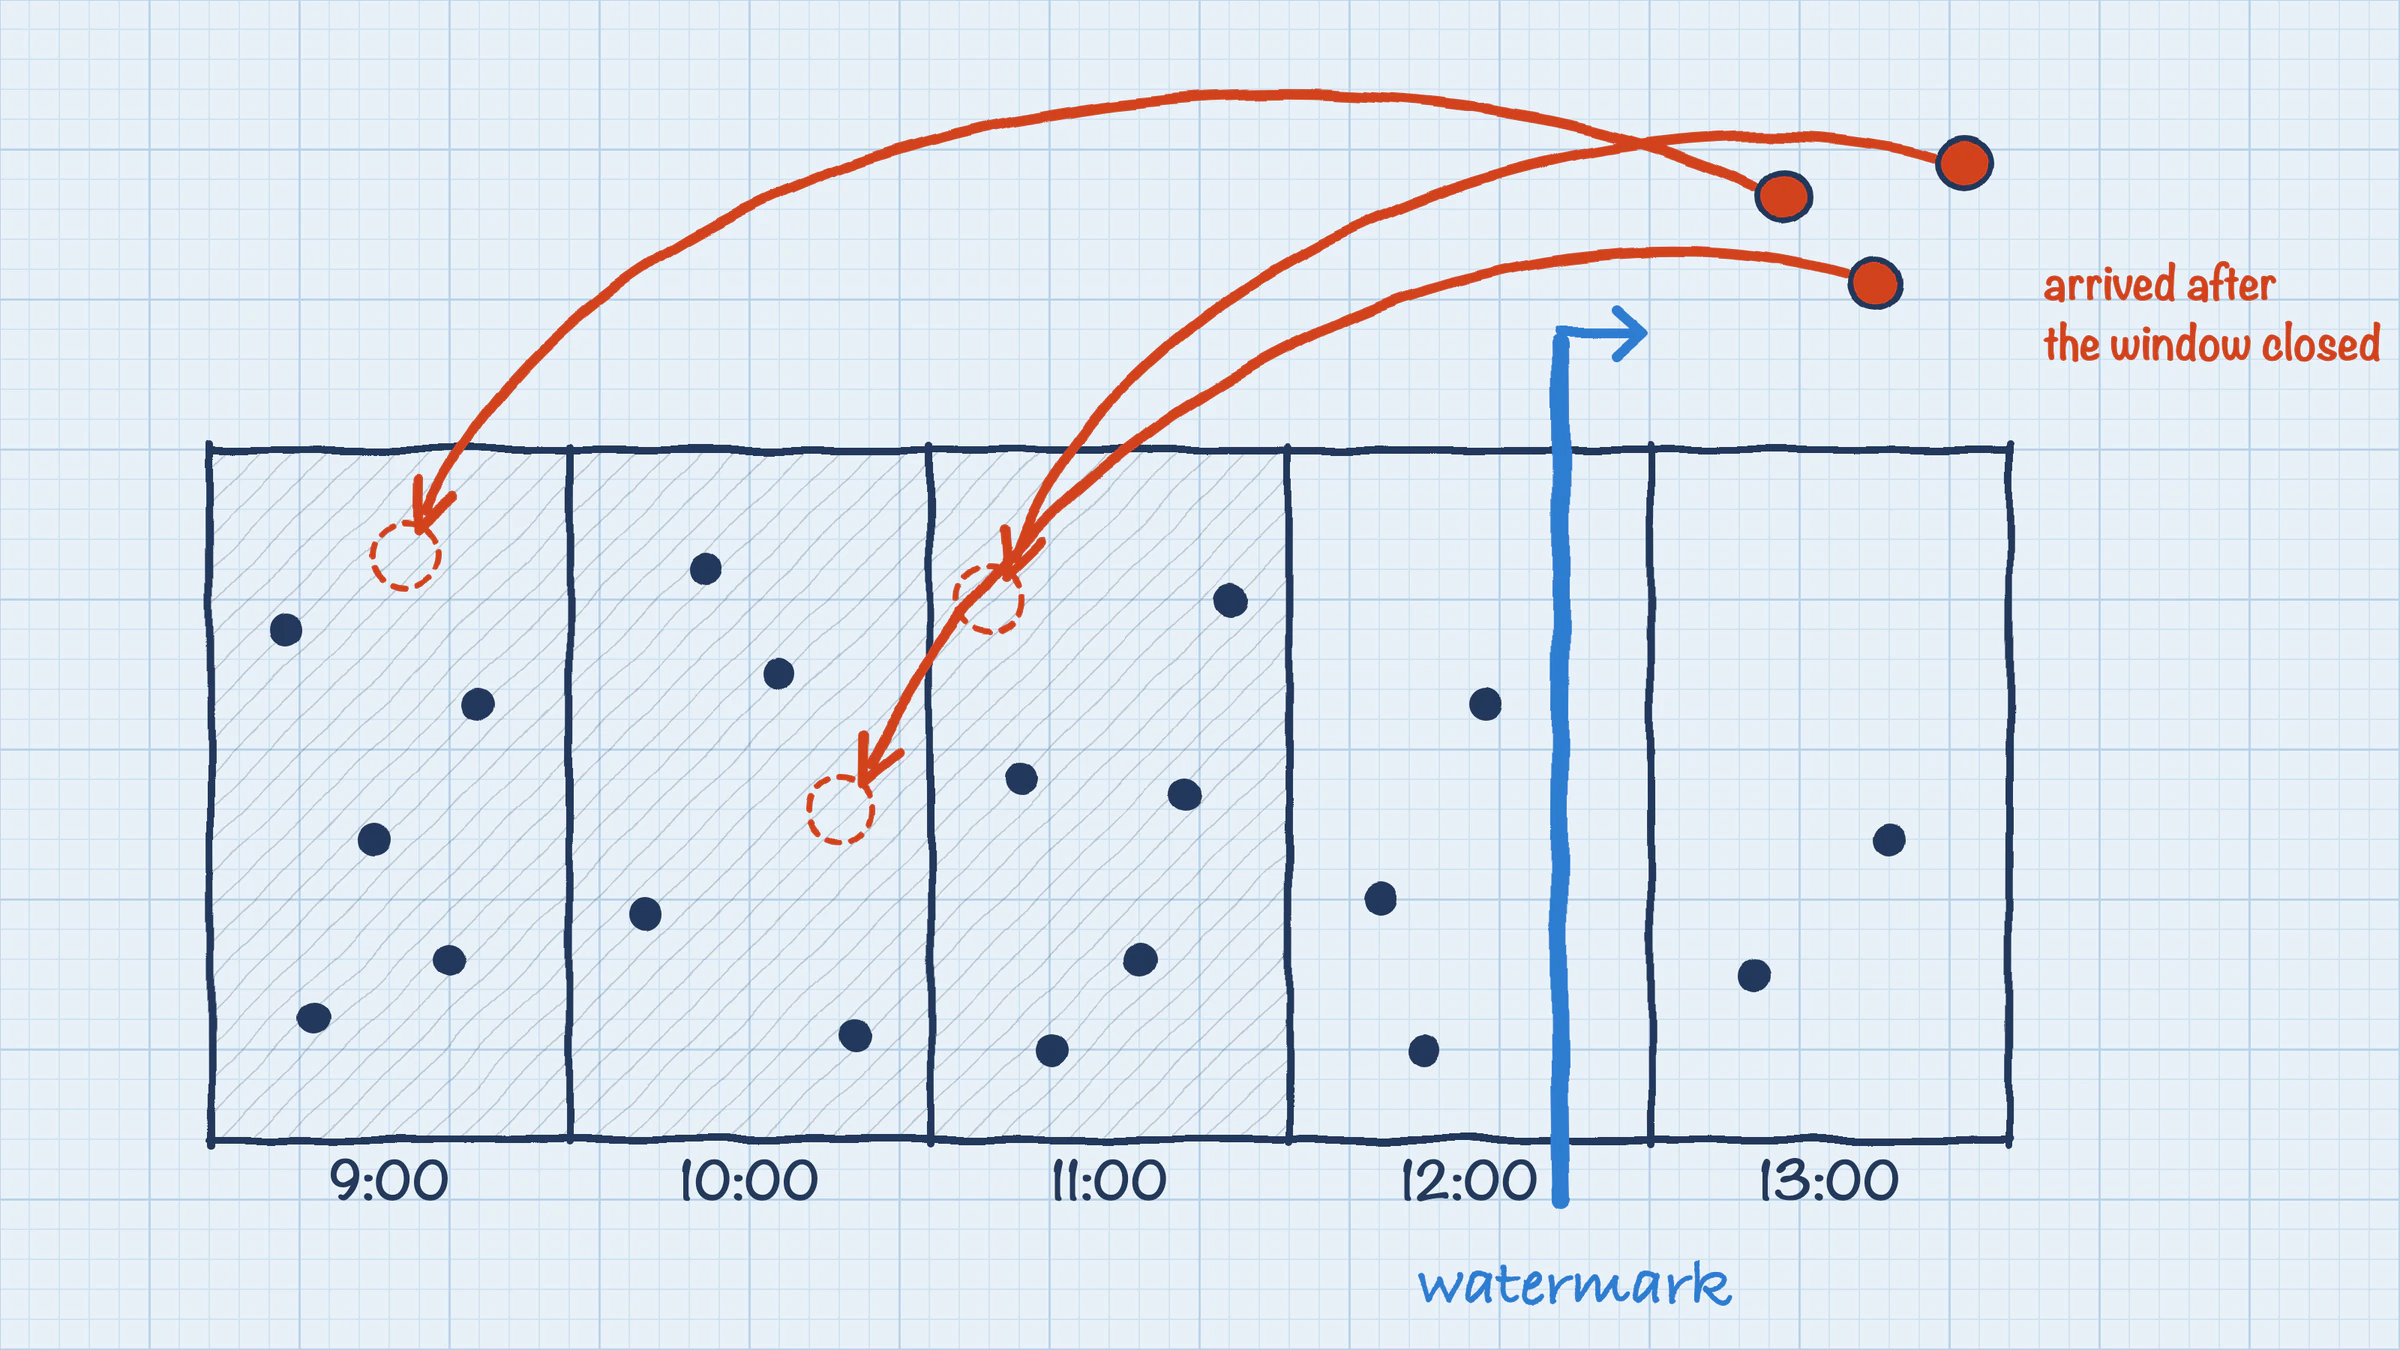
Yesterday's total was published at 6 a.m. By noon, events stamped with yesterday's date have shown up, and either the dashboard changed under someone who already quoted the number, or it did not change and now disagrees with the source system. This is the late arriving data pipeline problem, and both outcomes can be wrong. The decision hiding in it has little to do with your framework: what should a late event do to a number a human has already seen?
Most engineers meet this as a symptom: the streaming job and the nightly batch job report different totals for the same day. Streaming engines, by default or by configuration, can drop events that arrive after a point they consider closed. A batch job with a lookback window picks them up. The two will not match, and that mismatch is the incident. This post starts from the published number and works backward to the mechanism, so that a watermark is something you configure to implement a policy you chose, not a setting you inherit.
Event time, processing time, and why they diverge
Two clocks are in play.
- Event time is when the thing happened, as recorded in the record: a click timestamp, a sensor reading, a transaction time.
- Processing time is when your system saw it.
Apache Flink's documentation describes the trade: processing time is simple and fast, but results depend on arrival order and system speed. Event time gives consistent results regardless of arrival order, and it needs a mechanism to say when it is safe to finalize a result. That mechanism is the watermark.
The gap between the two clocks has ordinary causes: a mobile client that batches uploads until it has network, a partner system that sends files nightly, a queue backlog after an outage, a producer retry, a replayed topic, a source that commits late. None of these are bugs in your pipeline. They are properties of the inputs, so planning for them is part of the design.
What a watermark actually promises
Flink's documentation defines a watermark as a declaration that event time has reached time t, meaning there should be no more elements with a timestamp at or below t. The word "should" matters. A watermark is an assumption about completeness, not a fact. The engine estimates it from the data it has seen, typically the maximum event time observed minus a tolerance you set, and the real world is free to violate it.
Engines differ in what happens after the violation.
- Spark Structured Streaming documents that a watermark delay guarantees the engine will never drop data that is less than that far behind the latest data processed. The guarantee is strict in only one direction: data delayed by more than the threshold may or may not be aggregated, and the more delayed it is, the less likely it is processed. State for windows older than the watermark is cleared, and in Append output mode, results are written only after the watermark passes the window.
- Apache Flink sets allowed lateness to zero by default, and per its window documentation, elements that arrive behind the watermark are dropped. If you set allowed lateness above zero, window state persists until the watermark passes the window end plus that lateness, late elements are still added, and additional firings produce updated results for a window you already emitted. Flink also supports sending dropped late elements to a side output.
- Apache Beam treats data that arrives after the watermark passes the end of a window as late, and by default late data is discarded unless you configure triggers, such as late firings, and an accumulation mode.
- Databricks documents the same trade-off in its watermark guidance: shorter thresholds reduce latency and state but reject late arrivals, longer thresholds tolerate more lateness at the cost of memory and latency. Its default policy for multiple streams is the minimum watermark across them, and it recommends caution with the maximum policy, which can lose data from slower sources.
The common thread: by default, or past a threshold you set, late data does not reach your total, and nothing breaks. The job is green and the total is quietly short. That silent drop is the bug to design out.
Start from the published number
Before touching any watermark, decide the contract for the number, ideally with whoever reads it. For each published metric, answer:
- Who sees it, and when? A finance close is different from an operations counter.
- What happens to a late event? Pick one policy per metric and write it down.
- Can a published value change? If yes, how will readers learn it changed?
Three policies
- Restate. Late events change the period's value. Yesterday's total is correct once it settles, and it may differ from what someone read at 6 a.m. This requires versioning or an "as of" marker so a changed number is explainable.
- Land and reconcile. Late events are stored separately, counted, and applied by a job or a person on a schedule. The published number stays stable between reconciliations, and the late pile is visible.
- Ignore on purpose. Late events are dropped by design, because the metric is a live counter or because the business accepts the error. This is legitimate only when it is a decision, documented, and measured: you know how many events you dropped and that the number is small enough.
The failure is the fourth, unlisted policy: ignoring by accident. A job that drops late events with no counter, and a dashboard that implies the number is final, produce disagreement that nobody can explain.
Measure how late late is
Do not pick a lateness window from intuition. Measure the distribution of arrival delay on real data: the difference between when each record landed and its event time.
-- Illustrative (Postgres-style). Assumes events(event_time, ingested_at).
-- How long after the event do records arrive?
SELECT
  date_trunc('day', event_time)                                       AS event_day,
  count(*)                                                            AS events,
  percentile_cont(0.50) WITHIN GROUP (ORDER BY ingested_at - event_time) AS p50_delay,
  percentile_cont(0.99) WITHIN GROUP (ORDER BY ingested_at - event_time) AS p99_delay,
  max(ingested_at - event_time)                                       AS max_delay
FROM events
WHERE event_time >= now() - interval '30 days'
GROUP BY 1
ORDER BY 1;

-- What share of each day's events arrive after the day's report would have been published?
-- (6 hours after midnight of the next day is an assumed publish time.)
SELECT
  date_trunc('day', event_time) AS event_day,
  round(100.0 * count(*) FILTER (
    WHERE ingested_at > date_trunc('day', event_time) + interval '30 hours'
  ) / count(*), 3) AS pct_after_publish
FROM events
WHERE event_time >= now() - interval '30 days'
GROUP BY 1
ORDER BY 1;
Read the tail and the shape, not only the median. Delay distributions usually have a few distinct populations: most events arrive within seconds, a mobile or partner population arrives in hours, and a long tail arrives after outages or replays. Group by source, because a single partner's nightly file can explain the whole tail. Re-run the measurement after incidents and after changes in client behavior, because a lateness window set from last quarter's data goes stale.
If the share arriving after publication is negligible and stable, "ignore on purpose" may be right, as long as you keep measuring it. If it is material, you need restatement or reconciliation.
Fixing a late arriving data pipeline
In streaming: set the watermark on purpose
Choose the lateness tolerance from the measured distribution and the latency the product can accept. A longer tolerance corrects more and delays the number. A live counter cannot wait hours, and a daily finance total can.
In Spark, the watermark is declared on the event-time column before the aggregation, and it only bounds state cleanup under the conditions the documentation lists (append or update mode, an event-time aggregation, the watermark on the same column and applied before the aggregation).
# Illustrative PySpark Structured Streaming. Dropped data is the default past the
# threshold, so also count it (see the late-event audit below).
from pyspark.sql import functions as F

events = (
    spark.readStream.format("kafka")
    .option("subscribe", "orders")
    # ... connection options ...
    .load()
    .select(F.from_json(F.col("value").cast("string"), schema).alias("e"))
    .select("e.*")
)

daily = (
    events
    .withWatermark("event_time", "6 hours")   # tolerance chosen from measured delay
    .groupBy(F.window("event_time", "1 day"))
    .agg(F.count("*").alias("orders"))
)
In Flink, make the drop visible instead of silent: set allowed lateness deliberately, and send what still arrives too late to a side output you count and store.
// Illustrative Flink DataStream (Java), following the documented side-output pattern.
final OutputTag<Order> lateTag = new OutputTag<Order>("late-orders") {};

SingleOutputStreamOperator<DailyTotal> totals = orders
    .keyBy(Order::getTenantId)
    .window(TumblingEventTimeWindows.of(Time.days(1)))
    .allowedLateness(Time.hours(6))
    .sideOutputLateData(lateTag)
    .aggregate(new CountAndSum());

// Persist these for reconciliation, and export a counter of how many arrived.
DataStream<Order> tooLate = totals.getSideOutput(lateTag);
Two consequences to plan for. First, with allowed lateness above zero, Flink's documentation warns that your output will contain multiple results for the same window, so the sink must upsert by window key (or consumers must deduplicate), or you will double count. The same care applies if the pipeline sits on at-least-once infrastructure; see idempotent consumers. Second, a side output saves the events, but something has to apply them: a reconciliation job, or a person who reviews a report of late volume.
In batch: look back, and rebuild partitions
A common incremental pattern loads only rows newer than the maximum timestamp already in the target. The dbt documentation shows this pattern and states the caveat: late-arriving data older than the max timestamp will be missed on the next run. The remedy it shows is a lookback, filtering the source to a trailing window instead of the exact maximum, combined with a unique_key so reprocessed rows replace their earlier versions instead of duplicating.
-- Illustrative dbt model (SQL with Jinja). Reprocesses a trailing window each run,
-- merging on a key so late rows update, and rerun rows do not duplicate.
{{ config(
    materialized = 'incremental',
    unique_key = 'order_id',
    incremental_strategy = 'merge'
) }}

select
    order_id,
    tenant_id,
    event_time,
    ingested_at,
    amount
from {{ ref('stg_orders') }}
{% if is_incremental() %}
  -- Lookback sized from the measured p99+ delay, not a guess.
  where ingested_at >= (select coalesce(max(ingested_at), '1900-01-01') from {{ this }})
                       - interval '3 days'
{% endif %}
Filtering on arrival time (ingested_at) catches rows that are late by event time, since you are asking "what did I receive since last time, plus a safety margin," while filtering on event time with a lookback requires the lookback to exceed the worst delay. Choose deliberately, and state which column your lookback uses. A lookback has the same boundary as a watermark: anything later than the lookback is missed, so measure how often that happens, and run a periodic full refresh as the backstop. dbt's documentation also lists partition-based strategies such as insert overwrite and microbatch models for rebuilding whole time periods, which suit restatement of a day.
Make the two paths agree on purpose
If a streaming pipeline feeds a live view and a batch pipeline feeds the official numbers, they disagree whenever the stream's tolerance is shorter than the batch lookback. Either accept it and label them ("live, approximate" versus "settled"), or use the batch result to replace the streaming result once it lands. Do not show both under the same name.
Audit late events, and compare against a recompute
You need two checks that run on a schedule.
Late-event audit. Count late and dropped events per source per day. In Flink this is the side output; in Spark, derive it by comparing a raw landing table to the aggregated result, since the engine does not tell you what it dropped. A rising count is an early warning that a producer changed behavior.
Recompute comparison. For each closed period, recompute from raw events and compare to what was published.
-- Illustrative. published_daily is what readers saw; raw_events is the landing table.
WITH recomputed AS (
  SELECT date_trunc('day', event_time) AS day, count(*) AS orders, sum(amount) AS revenue
  FROM raw_events
  GROUP BY 1
)
SELECT r.day,
       p.orders  AS published_orders,  r.orders  AS recomputed_orders,
       r.orders - p.orders                         AS missing_orders,
       r.revenue - p.revenue                       AS missing_revenue
FROM recomputed r
JOIN published_daily p USING (day)
WHERE r.orders <> p.orders OR r.revenue <> p.revenue
ORDER BY r.day DESC;
If this returns rows, the published value was short. The size and recency of the differences tell you whether your tolerance is too tight. If it returns none, over time, your policy is working. Run it for several days after any change to a watermark or lookback.
Trade-offs and when not to use each fix
- A long lateness window corrects more and delays the number. It does not suit a live counter, and it increases state and cost in the engine.
- Dropping late data is simple and silently wrong. Use it only when the loss is measured and accepted.
- Restatement is correct and makes yesterday's report wrong. If downstream systems or humans have acted on the old value, they need a way to learn it changed, such as a version or an "as of" timestamp. Some contexts, such as regulated reporting, may forbid changing a published figure; confirm the rules with the owner of the report.
- A side output saves the events and requires a person or job to apply them. Without that job it becomes a graveyard.
- Waiting for completeness hurts any product that wanted a real-time number. Two numbers with honest labels often beat one number that is both slow and approximate.
Be careful with joins and multiple inputs: both Flink and Databricks document that the combined watermark follows the slowest input by default, so one lagging source holds back results for everything downstream, and loosening that setting trades latency for lost data. For events ordered through external systems, such as webhook handlers, do not assume arrival order matches event order.
What to do this week
- List your published metrics and write one sentence per metric stating its late-event policy. If you cannot, that is the finding.
- Run the arrival-delay query per source over the last 30 days and note the tail.
- Find where late data can be dropped silently: engine defaults, lookbacks,
max(timestamp)filters. Add a counter or a side output at each. - Set tolerances and lookbacks from the measured distribution, and write down the reasoning.
- Schedule the recompute comparison for closed periods, and alert on nonzero differences.
- Label any figure that can still change, and say when it settles.
Sources
- Apache Spark: Structured Streaming programming guide, handling late data and watermarking (watermark guarantee strict in one direction, state cleanup conditions, append versus update output)
- Apache Flink: Timely stream processing (event time versus processing time, watermark definition, minimum watermark across inputs, latency trade-off)
- Apache Flink: Windows, allowed lateness and side outputs (default of zero lateness, dropping, late firings, side output)
- Apache Beam: Programming guide, watermarks and late data (late data discarded by default, late firings, accumulation modes)
- dbt: Incremental models (late data missed by max-timestamp filters, lookback, unique key, partition strategies)
- Databricks: Watermarks in Structured Streaming (threshold trade-off, multiple stream watermark policy)
Written by
Azeem Subhani
Senior Full-Stack & AI Application Engineer
I build SaaS, booking, payment, real-time, and AI-enabled web platforms with React, Next.js, Node.js, NestJS, Django, PostgreSQL, and AWS. My work includes Stripe payment systems, white-label booking flows, real-time collaboration, RAG workflows, and developer automation.