Kubernetes OOMKilled Debugging: Container Limit, Node, or Heap?
Tell a container limit kill, a node memory kill, and a runtime heap failure apart before you raise a Kubernetes memory limit.
Azeem Subhani · · 10 min read
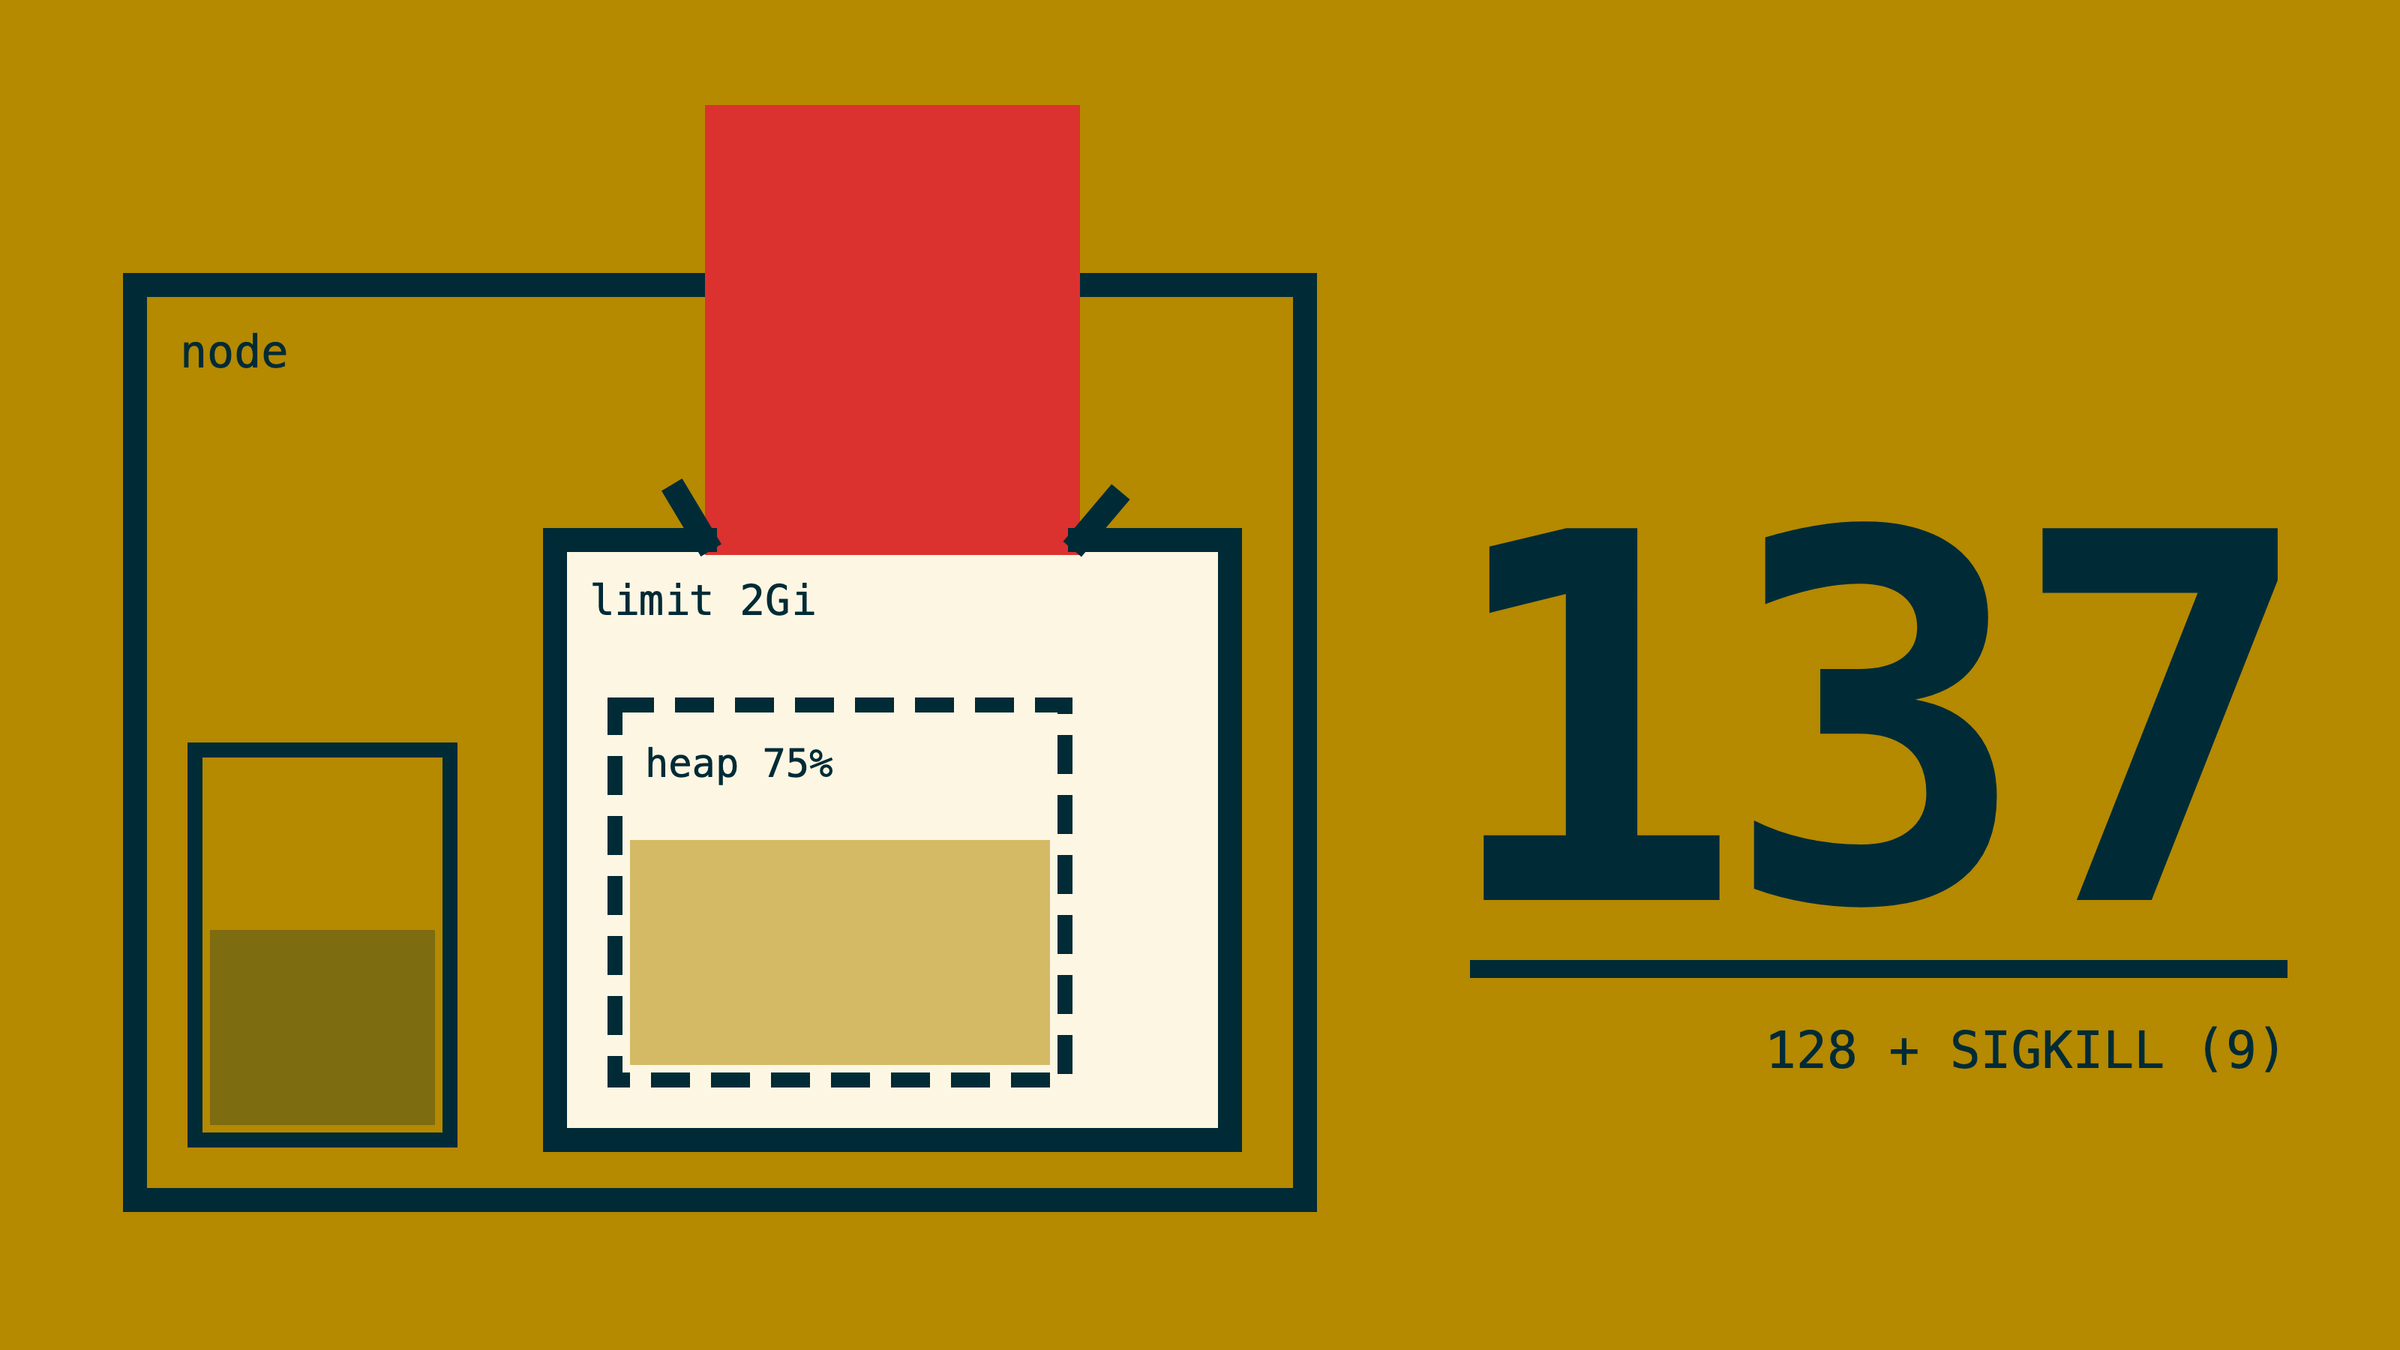
A container restarted. Someone sees exit code 137, says "OOMKilled," and opens a pull request that doubles the memory limit. The pod stops crashing for a week, the node packs worse, and then it crashes again at the new limit, or a different pod on the same node starts dying instead. Kubernetes OOMKilled debugging goes wrong at the first step because "out of memory" covers at least three different incidents: a container crossed its own cgroup limit, the node ran out of memory and something was evicted or killed, or the language runtime ran out of heap long before the cgroup noticed anything. Each has a different fix, and only one of them is "raise the limit."
This post gives you the first branch: how to tell those cases apart, what the memory curve says about leaks versus peaks, and which direction each fix should move. Kubernetes behavior described here follows the Kubernetes documentation as of v1.37 (October 2026).
Exit code 137 is not a diagnosis
Exit code 137 means the process received SIGKILL (128 plus signal 9). The kernel's OOM killer sends SIGKILL, but so do other things. What you need is the combination of three fields:
- The container's last termination reason.
OOMKilledmeans the container runtime recorded an OOM kill in the container's cgroup. - The pod's status reason.
Evictedmeans the kubelet removed the pod under node pressure, which is a different mechanism. - The pod's QoS class. It decides who gets evicted first and how the kernel ranks processes when the whole node is short.
Read all three before you change anything:
# Illustrative. Last termination state, pod-level reason, and QoS class.
kubectl get pod "$POD" -n "$NS" -o jsonpath='{range .status.containerStatuses[*]}{.name}{"\t"}{.lastState.terminated.reason}{"\t"}{.lastState.terminated.exitCode}{"\n"}{end}'
kubectl get pod "$POD" -n "$NS" -o jsonpath='{.status.reason}{"\t"}{.status.message}{"\t"}{.status.qosClass}{"\n"}'

# Events on the pod and the node around the restart.
kubectl describe pod "$POD" -n "$NS" | sed -n '/Events:/,$p'
kubectl describe node "$NODE" | grep -iE 'MemoryPressure|OOM|evict'
The Kubernetes memory assignment task shows what the first case looks like: lastState.terminated.reason: OOMKilled with exitCode: 137 on a container that allocated past its limit.
Three incidents behind Kubernetes OOMKilled
Google's GKE troubleshooting guide for OOM events draws the main line: a container-level OOM, where one container exceeds its limit and only that container is terminated, versus a node-level OOM, where the whole node runs out of memory and the kernel's global OOM killer picks a victim, possibly from a different workload. Add the runtime case and you have three branches.
Branch one: the container crossed its own limit
The container's cgroup has a hard memory limit. The kernel's cgroup v2 documentation describes memory.max as the hard limit and says that if usage reaches it and cannot be reduced, the OOM killer is invoked in that cgroup. Kubernetes records OOMKilled and the container restarts according to its restart policy.
Note how Kubernetes words this in its resource management docs: memory limits are enforced reactively. The kernel kills only when it detects memory pressure, so a container may be above its limit for a while before it dies. A metrics sample that shows usage under the limit at the time of the kill does not prove the limit was not the cause.
Branch two: the node ran out
If the node itself is short, two different things can happen:
- The kubelet evicts pods. Node-pressure eviction watches
memory.available, which the kubelet computes from cgroupfs as node capacity minus the working set, not fromfree. The default hard threshold ismemory.availablebelow 100Mi. An evicted pod hasphase: Failed,reason: Evicted, and a message naming the pressure condition. Eviction ranks pods first by whether their usage exceeds their requests, then by priority, then by usage relative to requests. - The kernel OOM killer fires before the kubelet reacts. The same page warns that the kubelet may not observe memory pressure fast enough. When the kernel acts first, it chooses using
oom_score_adj, which the kubelet sets by QoS class:-997for Guaranteed,1000for BestEffort, and for Burstablemin(max(2, 1000 - (1000 * memoryRequestBytes) / machineMemoryCapacityBytes), 999). Depending on the runtime, a container whose main process dies this way may still be reported asOOMKilled, even though its own usage was below its own limit.
That last point is the most misread case. If a container shows OOMKilled and its usage was well under its limit, look at the node, not the container. GKE suggests checking the kernel log on the node: a container-limit kill mentions the memory cgroup, while a node-wide kill reads as a generic out-of-memory kill of a process.
If no limits were ever set, branch one cannot happen at all. Such a container can grow until the node runs short, and the failure arrives as branch two, often hitting a different pod.
Branch three: the runtime ran out of heap
Managed runtimes have their own ceiling that is often far below the cgroup limit. A JVM throws OutOfMemoryError when its heap is full; Node.js aborts when V8's old space limit is reached. In both cases the cgroup may never be touched. If the process exits, the termination reason is typically Error, not OOMKilled; if the runtime catches the error, the process may keep running in a degraded state, and the useful message is in the container's logs.
For the JVM, container support is on by default on Linux, per the java command reference, so the JVM reads the cgroup limit. But the default maximum heap is a fraction of it: Microsoft's Java container guidance lists 25 percent of available memory when more than 512 MB is available, and the OpenJDK proposal to raise that default for containers (JDK-8350596) was closed as Won't Fix. So a JVM in a large container can hit OutOfMemoryError with most of the container's memory unused, and a team that responds by raising the Kubernetes limit gets a bigger heap only by accident.
The opposite mistake is setting the heap equal to the container limit. Heap is not the whole process: metaspace, thread stacks, direct buffers, and native libraries all live outside it. The same Microsoft guidance warns against making the maximum heap equal to container memory because it can cause container OOM errors, and suggests 75 percent as a starting point.
The invisible kill: child processes
A container that runs several processes, such as a shell wrapper, a worker pool, or a browser with helper processes, can lose one child to the OOM killer while PID 1 keeps running. Kubernetes only sees PID 1, so nothing is recorded as OOMKilled; you see errors, a stuck worker, or a degraded service.
Whether this can happen depends on the cgroup version and kubelet settings:
- cgroup v1: GKE notes the OOM killer can pick any process in the cgroup, including a child, and Kubernetes may not know.
- cgroup v2 with Kubernetes 1.28 or later: the kubelet sets
memory.oom.groupon container cgroups (PR 117793, v1.28). The kernel doc defines this as treating the cgroup as an indivisible workload: all tasks are killed together or not at all. The kill becomes visible as a whole-containerOOMKilled. - cgroup v2 with the kubelet option
singleProcessOOMKill: true: added in v1.32 (PR 126096), it restores per-process killing. Clusters that set it are back to possibly invisible child kills.
To check from inside a running container on cgroup v2:
# Illustrative. Run inside the container (cgroup v2 mounts at /sys/fs/cgroup).
cat /sys/fs/cgroup/memory.max        # the limit, or "max" if none
cat /sys/fs/cgroup/memory.current    # current usage, including page cache
cat /sys/fs/cgroup/memory.peak       # high-water mark, if your kernel exposes it
cat /sys/fs/cgroup/memory.events     # oom, oom_kill, oom_group_kill counters
cat /sys/fs/cgroup/memory.oom.group  # 1 means group kill
grep -E '^(anon|file) ' /sys/fs/cgroup/memory.stat
The kernel defines oom_kill in memory.events as the number of processes in the cgroup killed by any kind of OOM killer. A rising oom_kill count with no container restart is the signature of a child-process kill. anon versus file in memory.stat separates allocated memory from page cache; file includes tmpfs and shared memory, which matters if you write to a memory-backed volume.
On GKE, the guide gives a Logs Explorer query for node logs that looks for TaskOOM and ContainerDied entries for the pod. That query is GKE-specific; on other platforms, read the node's kernel log or your runtime's events.
Read the memory curve, not one sample
Once you know the branch, the shape of usage over time tells you what to fix. Plot the container's working set across several restarts, and the node's available memory on the same axis.
- A steady climb that resets at each restart: a leak or an unbounded cache. Raising the limit only stretches the interval between crashes.
- Flat, then a spike to the limit: a legitimate peak (a large request, a batch, a report export) or a limit set below the real peak.
- Container well under its limit, node available memory near zero: branch two. Look at what else is on the node and at requests across all pods.
- Container memory flat and far below the limit, runtime error in logs: branch three. The heap ceiling, not the cgroup, is the constraint.
GKE warns that monitoring metrics are sampled at intervals and often miss the fast spike that triggers a kill. Use memory.peak or the memory.events counters when you need to know whether the limit was actually reached.
To tell a leak from a peak inside the process, you need a profile. Heap dumps on failure are cheap to enable: the JVM's -XX:+HeapDumpOnOutOfMemoryError writes a dump when OutOfMemoryError is thrown, and Node.js's --heapsnapshot-near-heap-limit writes V8 snapshots as the heap approaches its limit, per the Node.js CLI docs. Both write to disk, so point them at a volume that survives the restart and is large enough.
Fixes by branch
Do not pick a number until the branch is known. The direction of each fix:
Container limit, steady climb. Fix the leak or bound the cache. Common culprits are per-key caches without eviction, request-scoped objects held in a global map, and listeners that are never removed. Verify by watching the slope flatten across a full traffic cycle.
Container limit, spike. Measure the real peak (from memory.peak, or from a load test that exercises the largest request), then set the limit to that peak plus overhead for runtime and page cache. Better still, bound the peak: stream large responses, cap batch sizes, or paginate exports. A keyset pagination export holds one page in memory instead of the whole result.
Node pressure. Set memory requests to realistic steady-state usage so the scheduler does not overpack the node. Pods whose usage exceeds requests are the first eviction candidates, so honest requests protect the pods you care about. For critical workloads, Guaranteed QoS (requests equal to limits for every container, per the QoS docs) gives the lowest oom_score_adj and evicts last.
Runtime heap. Size the heap from the container limit with headroom for non-heap memory:
# Illustrative Deployment fragment. The heap is a percentage of the cgroup
# limit, leaving room for metaspace, threads, and direct buffers.
spec:
  template:
    spec:
      containers:
        - name: api
          image: registry.example.com/api:1.42.0
          resources:
            requests:
              memory: "1536Mi"
            limits:
              memory: "2Gi"
          env:
            - name: JAVA_TOOL_OPTIONS
              value: >-
                -XX:MaxRAMPercentage=75
                -XX:+HeapDumpOnOutOfMemoryError
                -XX:HeapDumpPath=/dumps
          volumeMounts:
            - name: dumps
              mountPath: /dumps
      volumes:
        - name: dumps
          emptyDir: {}
For Node.js, set --max-old-space-size (in MiB) explicitly below the container limit, leaving room for buffers and native memory, through NODE_OPTIONS or the start command. Recent Node.js releases also document a --max-old-space-size-percentage flag; check node --help on your version before relying on it.
Child-process kills. Decide whether you want group kill. For most services, a whole-container kill that Kubernetes sees and restarts is better than a silently degraded worker pool. If you run a supervisor that must survive a child's death, keep that deliberate and alert on oom_kill increases.
Trade-offs of each fix
- A higher limit without a leak fix moves the crash later and reserves more node memory per replica, which packs nodes worse and can push the problem into branch two.
- Guaranteed QoS protects the pod from eviction and the OOM killer and reduces density, because requests equal limits and nothing can burst.
- A tight limit contains a leak's blast radius to one container and also kills legitimate spikes. It is the right choice for workloads where a restart is cheap and a node-wide incident is not.
- Heap headroom wastes some memory on purpose. Shrinking it to save cost moves failures from the runtime into the cgroup, which is harder to debug.
- Profiling and heap dumps cost CPU, disk, and sometimes pause time. Run them on one replica or in staging under realistic load, then turn them off.
- Group OOM kill makes failures visible and kills the whole container, which may be more disruption than a multi-process workload expects.
Memory limits and CPU limits are the two settings where "the limit is doing something" is the diagnosis. If the symptom is slow responses rather than restarts, check CPU throttling and the tail latency it produces before touching memory.
Before you change the limit
- Read
lastState.terminated.reason, podstatus.reason, andqosClasstogether. - Check node events and the kernel log for memory pressure, eviction, or a node-wide OOM kill.
- Read container logs for
OutOfMemoryErroror a V8 heap limit message. - On cgroup v2, read
memory.eventsforoom_killcounts that do not match restarts. - Plot working set across several restarts: slope means leak, spike means peak, flat means look elsewhere.
- Size runtime heaps from the container limit with headroom, not equal to it.
- Set requests to real steady-state usage.
- Raise the limit only to a measured peak plus overhead, and only after the branch is known.
Sources
- Google Cloud, Troubleshoot OOM events (GKE)
- Kubernetes, Resource Management for Pods and Containers
- Kubernetes, Node-pressure Eviction
- Kubernetes, Pod Quality of Service Classes
- Kubernetes, Assign Memory Resources to Containers and Pods
- Kubernetes PR 117793, use the cgroup aware OOM killer if available (v1.28)
- Kubernetes PR 126096, kubelet option for disabling group OOM kill (v1.32)
- Linux kernel, Control Group v2
- Oracle, The java command (JDK 21)
- Microsoft Learn, Containerize your Java applications
- OpenJDK, JDK-8350596 Increase default MaxRAMPercentage for containerized workloads
- Node.js, Command-line API
Written by
Azeem Subhani
Senior Full-Stack & AI Application Engineer
I build SaaS, booking, payment, real-time, and AI-enabled web platforms with React, Next.js, Node.js, NestJS, Django, PostgreSQL, and AWS. My work includes Stripe payment systems, white-label booking flows, real-time collaboration, RAG workflows, and developer automation.