Unexpected AWS Bill Investigation: Find the Usage Type and Resource
Trace a surprise AWS bill from the daily total to service, usage type, and resource, and learn which charges never carry a resource ID.
Azeem Subhani · · 11 min read
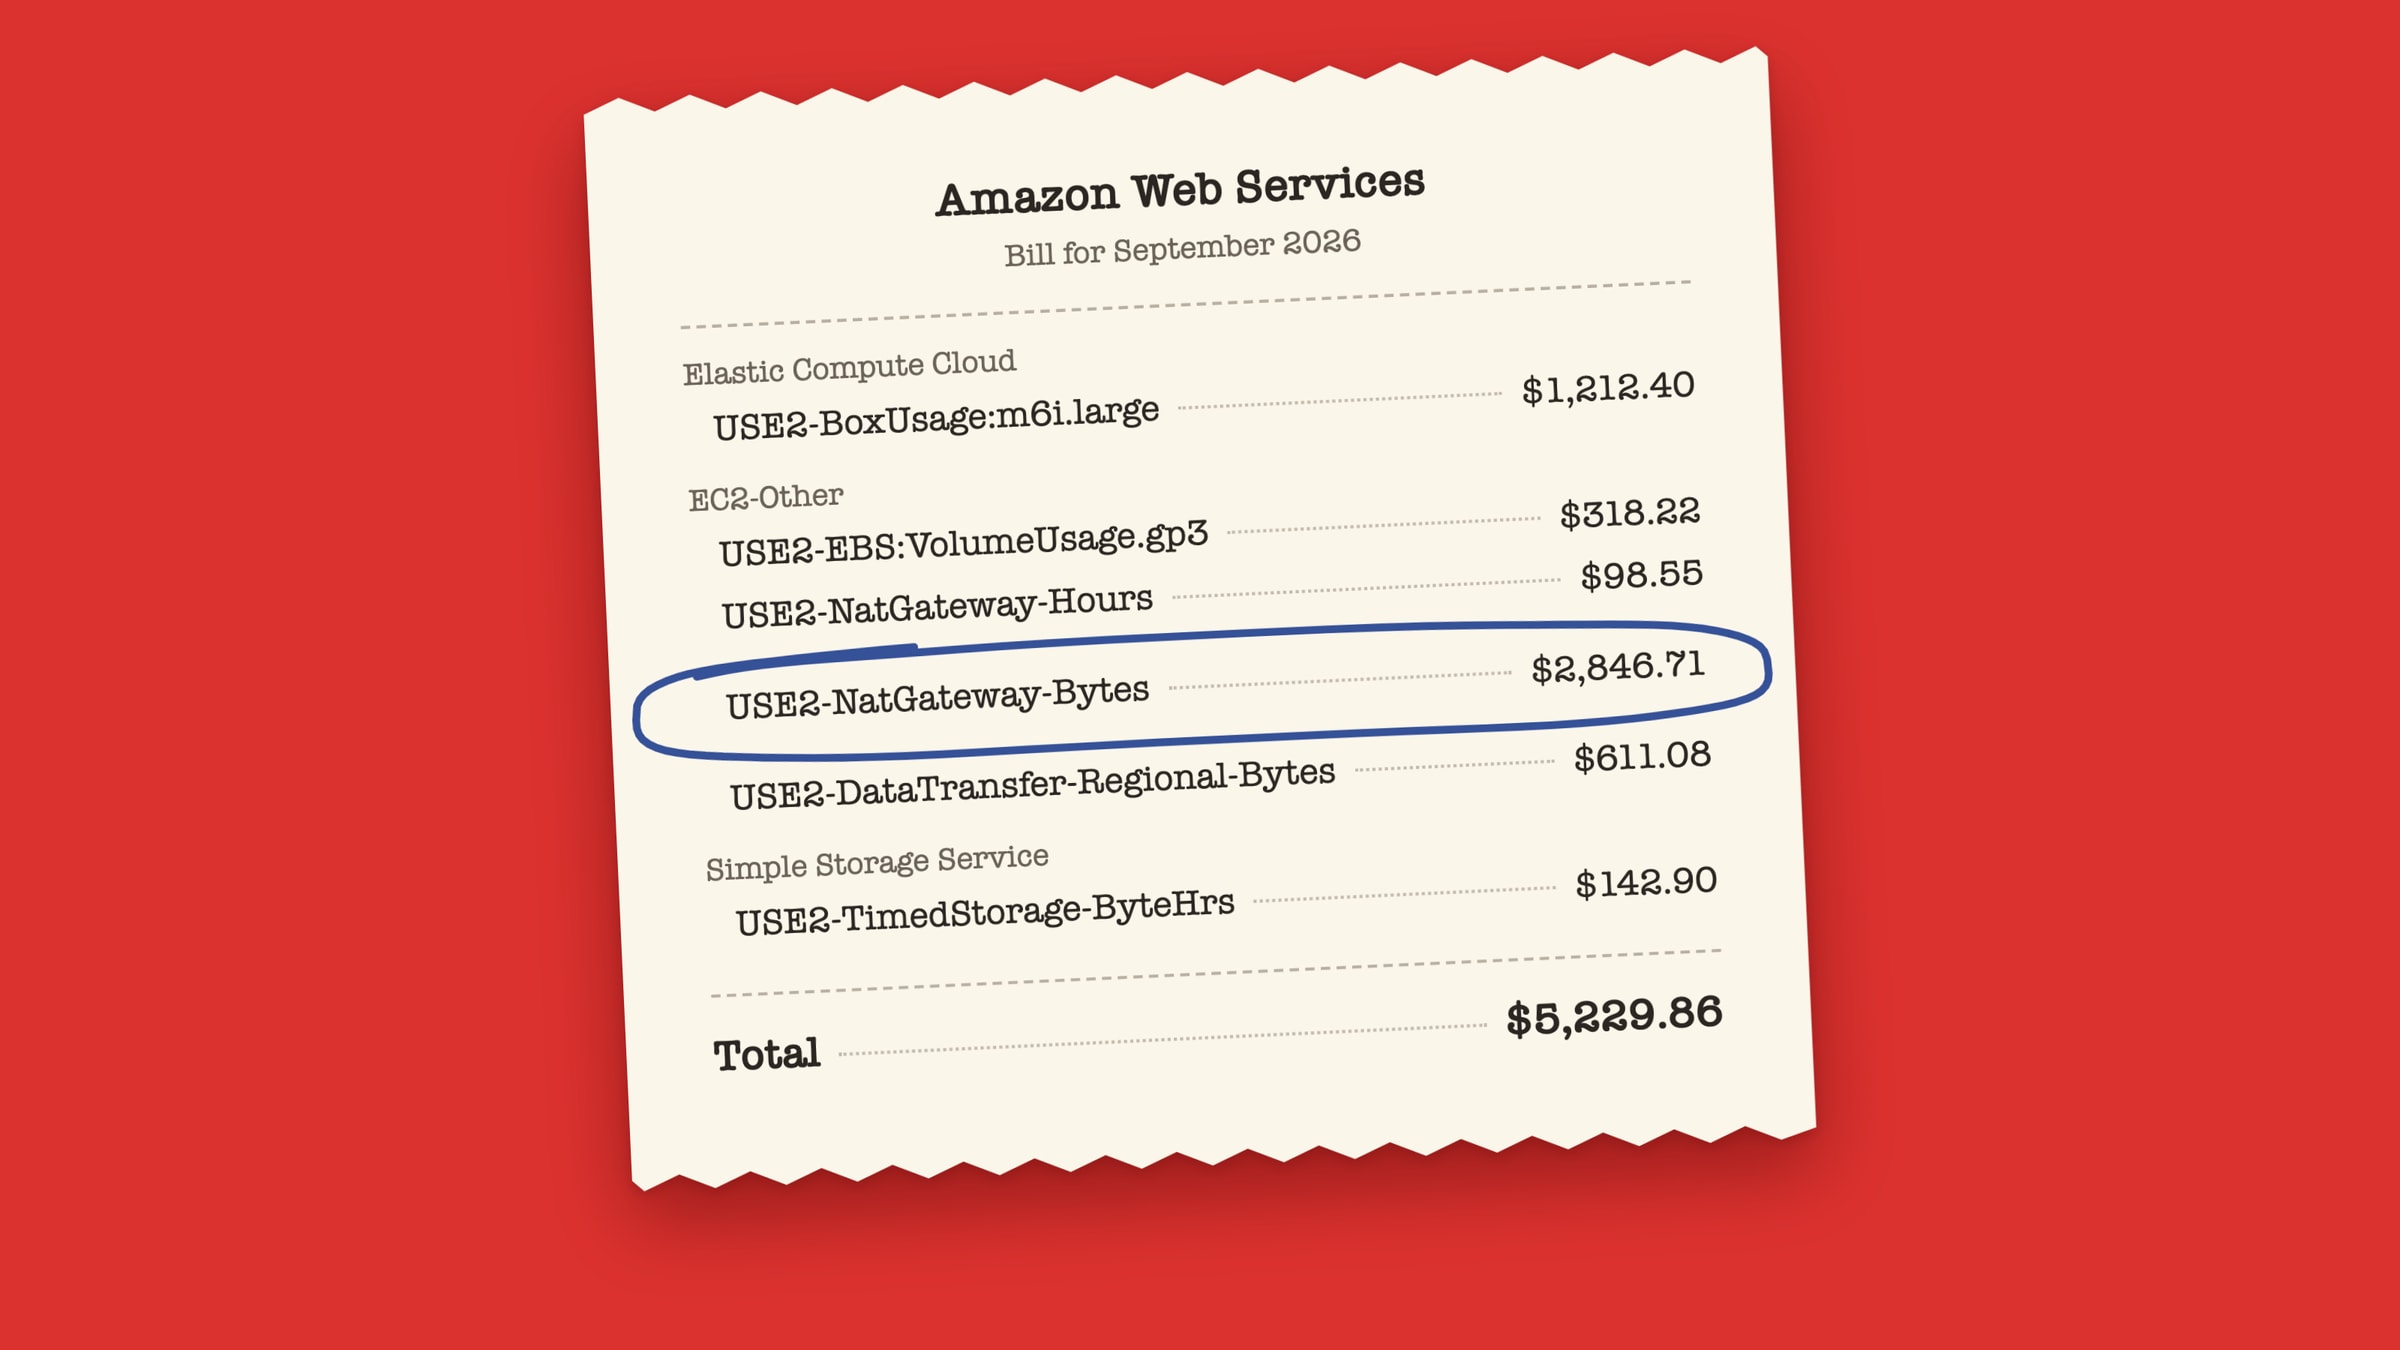
The monthly total jumped, nobody shipped a feature, and the console graph shows one taller bar. A careful engineer opens the bill, sees that Amazon EC2 is the biggest line, and concludes that someone scaled up instances. Sometimes that is true. Often the instance hours are flat and the increase is NAT gateway processing, cross-zone transfer, an expired credit, or a storage line that only lives inside the EC2 bucket by accident of how AWS groups charges. An unexpected cloud bill investigation goes faster when you stop looking at the total and walk the same short hierarchy every time: day, service, usage type, resource.
This post is that order of operations for AWS, using Cost Explorer and the Cost and Usage Report (CUR). It also covers the dead ends: charges that never carry a resource ID, data that lags by a day, and a network charge hiding inside a service that looks like compute.
Why the invoice total is not a cause
A bill is a sum of line items. Each one has a service, a usage type (the unit AWS meters, such as instance hours or bytes), a charge type (usage, credit, refund, tax, fees), and sometimes a resource ID. The total can move for three unrelated reasons:
- Usage changed. More hours, more gigabytes, more requests.
- The rate changed. A Savings Plan or reservation expired, usage moved to a different instance family or Region, or a tier boundary was crossed.
- An offset changed. A credit ran out or a refund landed in a different month. Usage and rate are identical, but the net cost rose.
These need different fixes, and the console's default view blends them. Cost Explorer's charge type dimension separates them: it lists Credit, Refund, Tax, Usage, Savings Plan covered usage and negation, recurring and upfront reservation fees, and support fees as distinct values. The same page notes that support fees and recurring reservation fees can produce spikes on the first day of every month, which is a common false alarm if you look at daily data without filtering charge types.
How Cost Explorer data behaves
Know the instrument before you trust the reading. Per the Cost Explorer overview:
- You can view up to the last 13 months of data, and the console is free to use. The Cost Explorer API charges per paginated request, so a script that loops over many group-by combinations is not free. Check the Cost Explorer pricing page for the current rate.
- Cost data refreshes at least once every 24 hours, and AWS says some data can arrive later than that because it depends on upstream billing systems. Yesterday's bar may still be filling in. Do not declare a spike over, or a fix successful, based on the most recent partial day.
- Cost Explorer uses the same dataset as the Cost and Usage Reports, so the two should agree once both have settled.
Cost Anomaly Detection inherits the same lag: AWS documents that it runs roughly three times a day on processed billing data, that detection can take up to 24 hours after usage occurs, and that a new service needs 10 days of history before anomalies are detected for it. An alert is a pointer to where to look, not an explanation.
An unexpected AWS bill investigation in six passes
Run these in order. Each pass narrows the next one. Write down what you saw at each step; the notes become the incident record.
- Switch to daily granularity and find the step. Monthly bars hide the shape. A step that starts on one day and stays flat points to a deploy, a config change, or an expired commitment. A ramp points to growth or a leak. A single tall day points to a batch job, a one-time fee, or a backfill. Note the first day the new level appears.
- Compare with the prior period. Cost Explorer's Cost Comparison analyzes two months and lists the largest drivers across services, accounts, and Regions, including usage and discount changes. The Billing console's Top trends widget shows the top 10 variations between the previous two months. Use it to confirm which service moved, not as the final answer.
- Group by service. One or two services usually account for most of the delta. If the mover is "EC2-Other", do not stop: AWS describes EC2-Other as covering EBS volumes and snapshots, Elastic IP addresses, data transfer, NAT gateways, and more. It is a grab bag, not a service.
- Filter to that service and group by usage type. This is the step most investigations skip, and it is where the answer usually is. Usage types name the meter:
BoxUsagefor instance hours,NatGateway-Bytesfor NAT processing, orDataTransfer-Regional-Bytesfor traffic between Availability Zones. Cost Explorer also offers usage type groups such as "EC2: NAT Gateway - Data Processed" and "EC2: Data Transfer - Inter AZ" if raw names are too granular. - Check charge type before blaming usage. Add the Charge type filter. If Usage is flat and Credit shrank, the bill rose because an offset ended. If Savings Plan covered usage fell while On-Demand usage rose, a commitment expired or stopped matching the workload.
- Group by resource where the service supports it, then by tag. Resource-level grouping turns "S3 storage went up" into "this bucket." Tags turn "these 40 instances" into "the reporting team's batch cluster." Where neither exists, go to the CUR (next section) or to service-native tools such as VPC Flow Logs.
Separate rate from usage with one query
Pull cost and usage quantity side by side for the moving service, grouped by usage type. The CLI reference notes that UsageQuantity sums numbers without regard to units unless you filter or group by usage type, so always group or filter before you read it. The end date is exclusive.
# Illustrative. Daily cost and usage for EC2-Other, grouped by usage type.
# End date is exclusive. Each paginated API request is billed.
aws ce get-cost-and-usage \
  --time-period Start=2026-09-01,End=2026-10-01 \
  --granularity DAILY \
  --metrics UnblendedCost UsageQuantity \
  --filter '{"Dimensions":{"Key":"SERVICE","Values":["EC2 - Other"]}}' \
  --group-by Type=DIMENSION,Key=USAGE_TYPE \
  --output json > ec2-other-by-usage-type.json
Confirm the exact service value in your account first with aws ce get-dimension-values --dimension SERVICE over the same period, since display names and API values can differ.
Read the result per usage type:
- Cost up, usage up in the same proportion: a real usage change. Find who generates it.
- Cost up, usage flat: a rate or offset change. Look at charge types, commitments, and Region.
- Usage up only in a transfer or processing usage type: traffic moved to a more expensive path. The companion post on NAT gateway and cross-AZ charges covers that diagnosis end to end.
Resource-level data and its limits
Cost Explorer can show resource-level data at daily granularity for the past 14 days, for services you opt in. Facts that shape how useful it is:
- It must be enabled first. AWS says the data becomes available within 48 hours of enabling. The filter documentation says the opt-in happens on the Cost Explorer settings page as the management account. If you enable it the day of the incident, plan around that delay rather than assuming the window is already populated.
- Costs for services you have not enabled appear under "No resource ID."
- The console shows the top 5,000 most costly resources per service; beyond that you search by ID or use the CUR.
- AWS disables the feature for an organization if no one accesses it for three consecutive months.
- The API path,
get-cost-and-usage-with-resources, is limited to the last 14 days and its filter must include the EC2 compute service. The console offers more services than the API.
So resource-level data answers "which instance or bucket" for recent spikes in supported services. It does not answer last quarter's question, and it does not help for usage that has no resource at all.
Charges that never show a resource ID
Some lines will never point at a resource, no matter what you enable. The CUR 2.0 data dictionary says line_item_resource_id is blank for usage types not tied to an instantiated host, such as data transfers and API requests, and for line item types such as discounts, credits, and taxes. In practice that means:
- Data transfer between Availability Zones, between Regions, and out to the internet is attributed by usage type, not by resource. The CUR documentation on data transfer charges says inter-AZ transfer appears as
Region-DataTransfer-Regional-Bytes(for exampleUSE2-DataTransfer-Regional-Bytes), that you are charged for both inbound and outbound traffic within a Region, and that each metered resource gets two such line items per transfer. A usage type with no Region prefix belongs to US East (N. Virginia). - Credits, refunds, taxes, and discounts are account-level adjustments.
- Request-metered usage such as API calls is often attributed to the service and operation, not a specific caller.
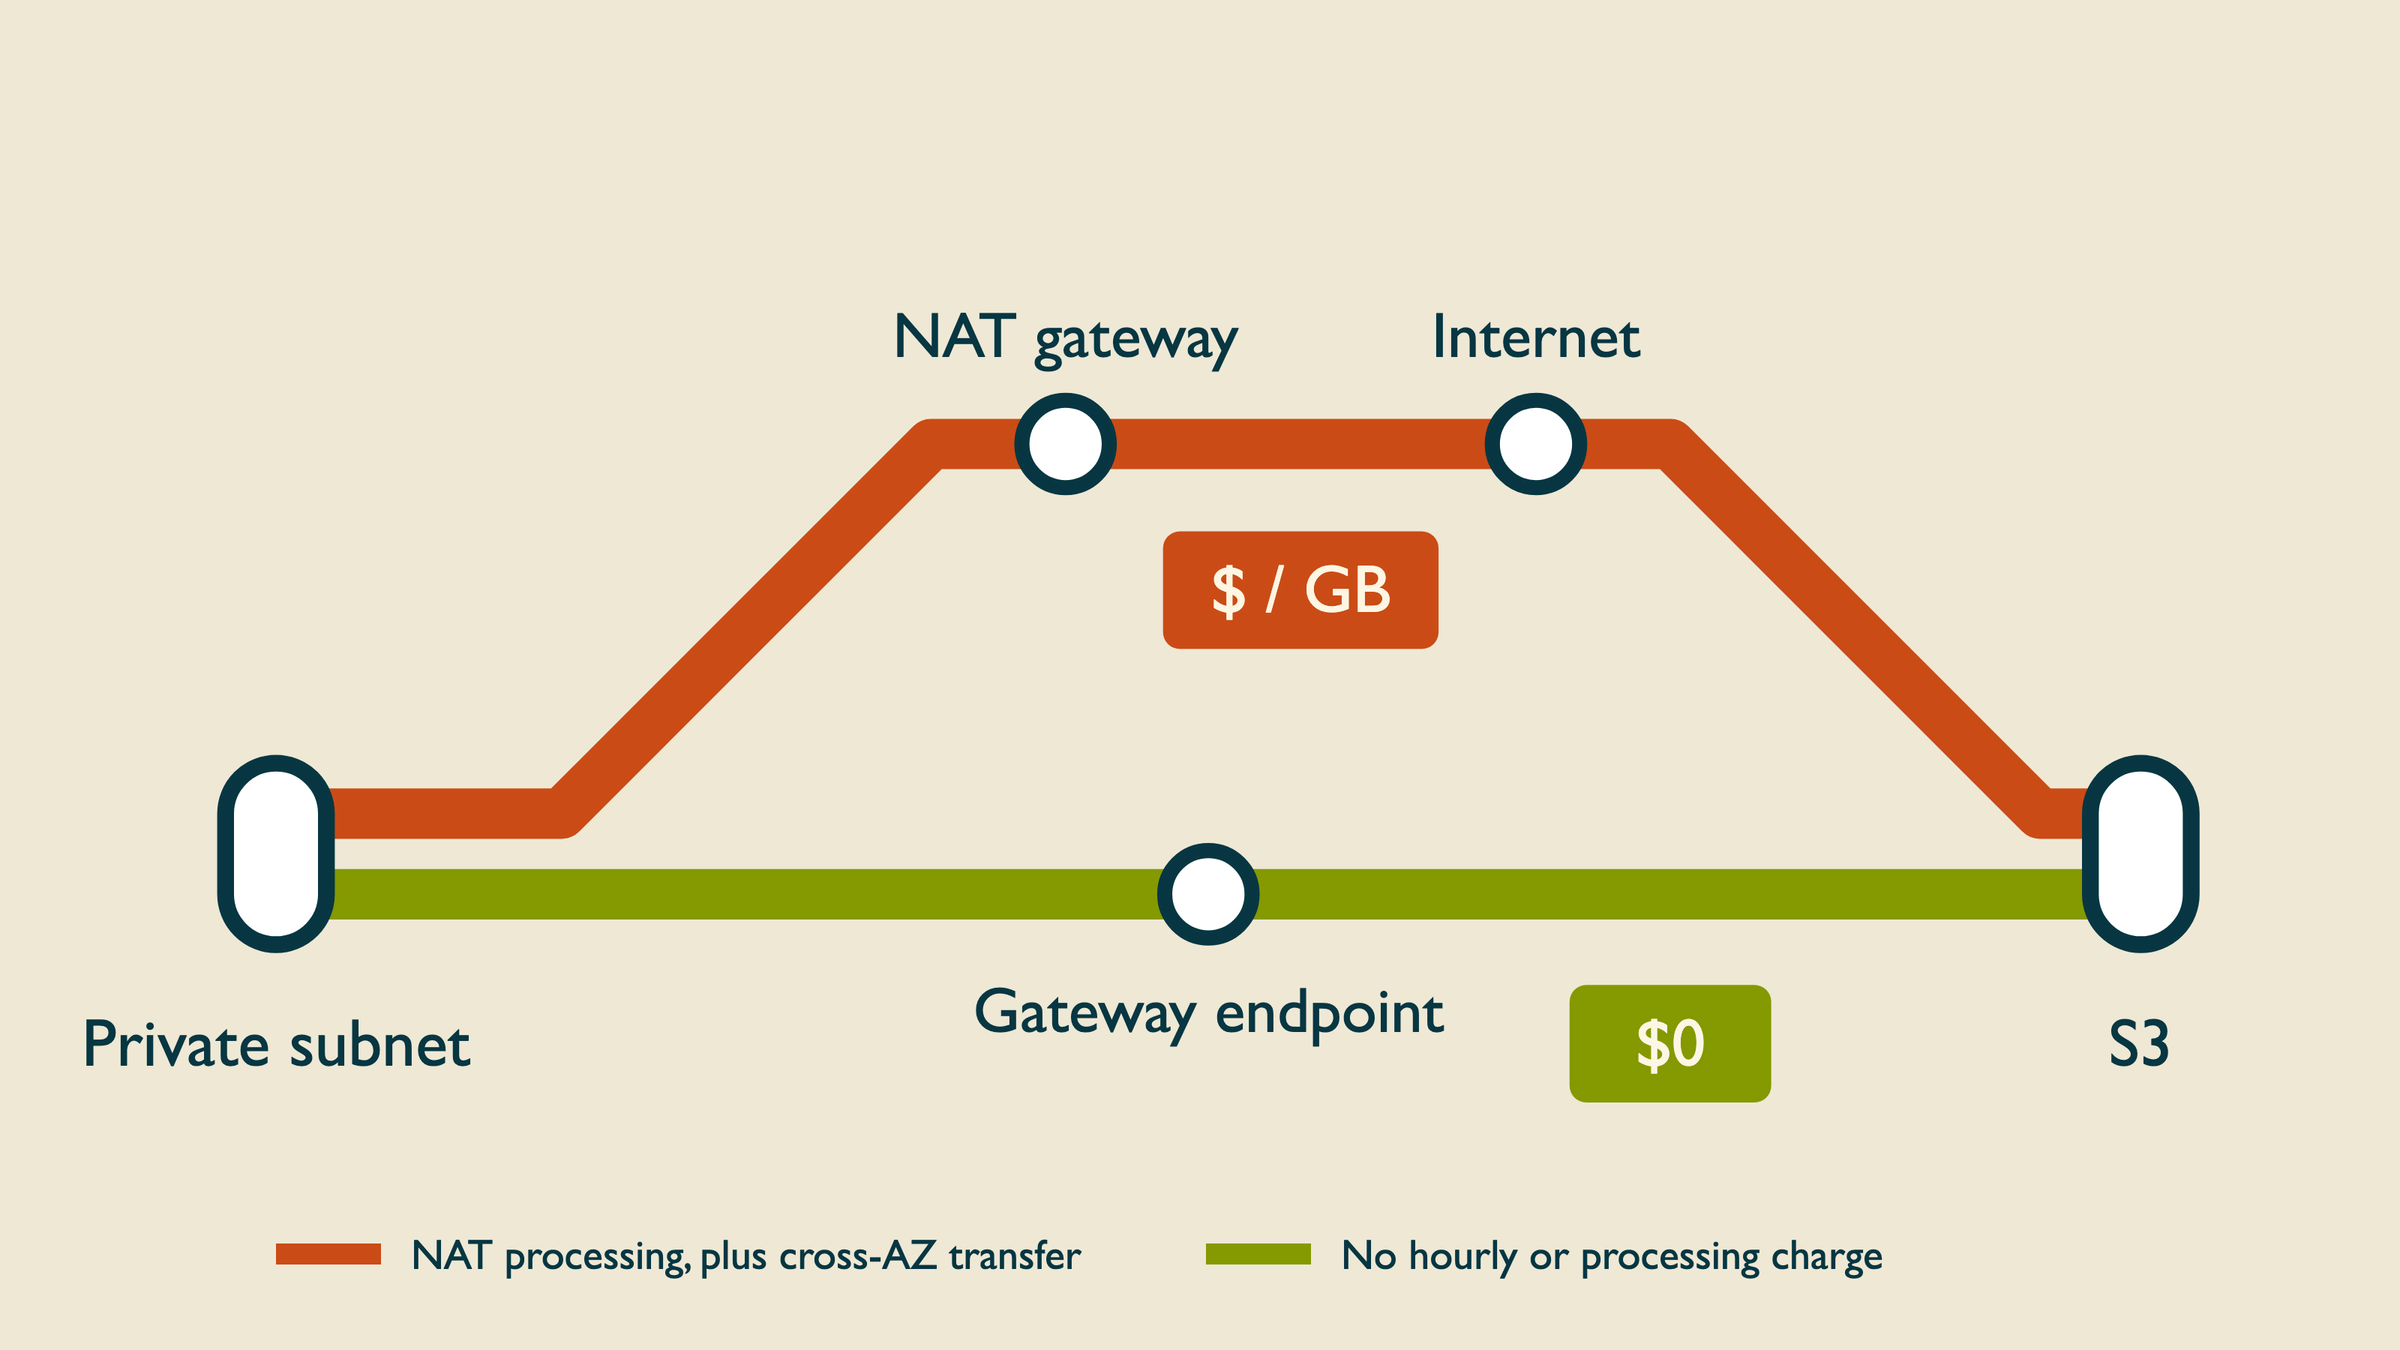
Some processing charges do carry an ID. AWS's own walkthrough of data transfer in the CUR (May 2022) filters NAT gateway lines with line_item_resource_id like '%nat%', and it notes that NAT Gateway, Transit Gateway, and PrivateLink record their data processing charges under their own service names rather than as generic data transfer. That is the trap behind many "EC2 went up" reports: the NAT processing is real and identifiable, but the cross-AZ bytes that accompany it are not tied to any one resource.
When the resource ID is blank, the next tool is not the bill. It is the network: VPC Flow Logs or service metrics tell you which addresses moved the bytes.
Using the Cost and Usage Report for the long tail
The CUR is the complete, line-level dataset. Export it with resource IDs included, query it with Athena, and you can answer questions Cost Explorer's 14-day window cannot. A query that ranks usage types by day-over-day change for a moving service:
-- Illustrative. CUR 2.0 table queried in Athena.
-- Compare the week before the step with the week after it.
WITH daily AS (
  SELECT
    line_item_product_code                     AS product,
    line_item_usage_type                       AS usage_type,
    date_trunc('day', line_item_usage_start_date) AS usage_day,
    SUM(line_item_unblended_cost)              AS cost,
    SUM(line_item_usage_amount)                AS usage_amount
  FROM cur2
  WHERE line_item_line_item_type = 'Usage'
    AND line_item_usage_start_date >= TIMESTAMP '2026-09-08 00:00:00'
    AND line_item_usage_start_date <  TIMESTAMP '2026-09-22 00:00:00'
  GROUP BY 1, 2, 3
)
SELECT
  product,
  usage_type,
  AVG(CASE WHEN usage_day <  TIMESTAMP '2026-09-15 00:00:00' THEN cost END) AS avg_cost_before,
  AVG(CASE WHEN usage_day >= TIMESTAMP '2026-09-15 00:00:00' THEN cost END) AS avg_cost_after,
  AVG(CASE WHEN usage_day <  TIMESTAMP '2026-09-15 00:00:00' THEN usage_amount END) AS avg_usage_before,
  AVG(CASE WHEN usage_day >= TIMESTAMP '2026-09-15 00:00:00' THEN usage_amount END) AS avg_usage_after
FROM daily
GROUP BY 1, 2
ORDER BY (COALESCE(avg_cost_after, 0) - COALESCE(avg_cost_before, 0)) DESC
LIMIT 20;
Swap the line_item_line_item_type filter to 'Credit' and run it again to see whether an offset changed. Add line_item_resource_id to the grouping once you know the usage type, keeping in mind it will be empty for transfer and request lines. Your table name, partition columns, and column set depend on how the export was configured.
Tags, alerts, and tools after the first investigation
Once one spike has been explained by hand, invest in making the next one faster. In this order:
- Cost allocation tags. Tags are the durable way to map spend to owners. They also take time: AWS documents that new tag keys can take up to 24 hours to appear for activation and up to another 24 hours to activate. Tagging today does nothing for last week's untagged spike, so do not hold an investigation open waiting for tags.
- Resource-level data for the services you actually spend on. Enable it before you need it, and keep someone looking at it so it is not disabled after three idle months.
- Anomaly alerts. Add Cost Anomaly Detection monitors only after a person can already trace one spike through the six passes above. AWS lets you investigate root causes by service, account, Region, or usage type, which maps onto the same hierarchy. An alert without a practiced investigation is just a faster way to be confused.
- Third-party cost products. They can speed up the second and tenth investigation, especially across many accounts. They are not a substitute for knowing what a usage type means. If the team cannot read a raw usage type, a dashboard will only make the wrong conclusion look more official.
Trade-offs and when not to bother
- Resource-level data is short-window and not available for every service. It is the wrong tool for a slow drift over a quarter; use the CUR.
- Tagging is durable and cheap per resource but needs enforcement to stay accurate. Untagged resources quietly fall into "unallocated."
- The CUR plus Athena answers anything but costs setup time and query spend, and needs someone who knows the schema. For a small account with one spike, Cost Explorer grouping by usage type is usually enough.
- Anomaly detection has a built-in lag of up to a day plus a 10-day warm-up for new services, so it cannot catch a runaway job within hours. Pair it with service-level alarms (for example, on NAT gateway bytes) if same-day detection matters.
Verifying the fix
A fix is verified when the meter that moved goes back down, not when the total looks better. Watch the specific usage type at daily granularity for several full days after the change, ignoring the most recent partial day. Check that no other usage type rose to replace it: removing NAT processing by adding interface endpoints, for example, can trade one per-GB line for an hourly one. If the drop is smaller than expected, the change probably covered only part of the traffic, and the next step is again the network data rather than the bill.
The same discipline applies when the moving usage type is not infrastructure at all. If the step is in monitoring metrics, the cause is often a new high-cardinality label multiplying the number of time series; the post on metric cardinality covers how to find it. If it is a model API line, LLM cost accounting makes the same argument for token spend: the invoice hides which call paid for what.
Checklist
- Switch to daily granularity and find the first day of the new level.
- Run Cost Comparison for the two months, then group by service.
- Never stop at "EC2-Other". Group by usage type.
- Filter Charge type for Credit, Refund, and Savings Plan lines before blaming usage.
- Pull
UnblendedCostandUsageQuantitytogether per usage type to split rate from usage. - Use resource-level data for the last 14 days in supported services, and the CUR for everything else.
- Expect no resource ID on data transfer, API requests, credits, and taxes. Go to flow logs for transfer.
- Use your Region's current rates from the pricing pages rather than numbers copied from an old ticket.
- After the fix, verify on the specific usage type, over full days, and check nothing replaced it.
Sources
- AWS, Analyzing your costs and usage with AWS Cost Explorer
- AWS, Resource-level data at daily granularity
- AWS, Filtering the data that you want to view (Cost Explorer dimensions, charge types, usage type groups)
- AWS, Comparing your costs between time periods
- AWS CLI reference, get-cost-and-usage
- AWS CLI reference, get-cost-and-usage-with-resources
- AWS, CUR 2.0 line item columns
- AWS, Understanding data transfer charges in the CUR
- AWS Networking blog, Understand AWS data transfer details in depth from the CUR (2022)
- AWS Cloud Financial Management blog, Optimize and save on the "other" services
- AWS, Detecting unusual spend with Cost Anomaly Detection
- AWS, Activating user-defined cost allocation tags
- AWS Cost Explorer pricing
Written by
Azeem Subhani
Senior Full-Stack & AI Application Engineer
I build SaaS, booking, payment, real-time, and AI-enabled web platforms with React, Next.js, Node.js, NestJS, Django, PostgreSQL, and AWS. My work includes Stripe payment systems, white-label booking flows, real-time collaboration, RAG workflows, and developer automation.