LLM API Cost Unexpectedly High: Find Which Calls Drive the Bill
The token price did not change but your LLM bill did. Trace it by feature, call pattern, and token type, with retries and loops.
Azeem Subhani · · 12 min read
Your LLM API cost is unexpectedly high this month, and the price per token did not change. That combination is the useful clue. A bill is price times quantity, and when the price is flat, the quantity moved: more calls per user action, more tokens per call, a different model behind a default, or work that used to happen once and now repeats. Looking at the model's rate card will not find it. Looking at what your own code sent will.
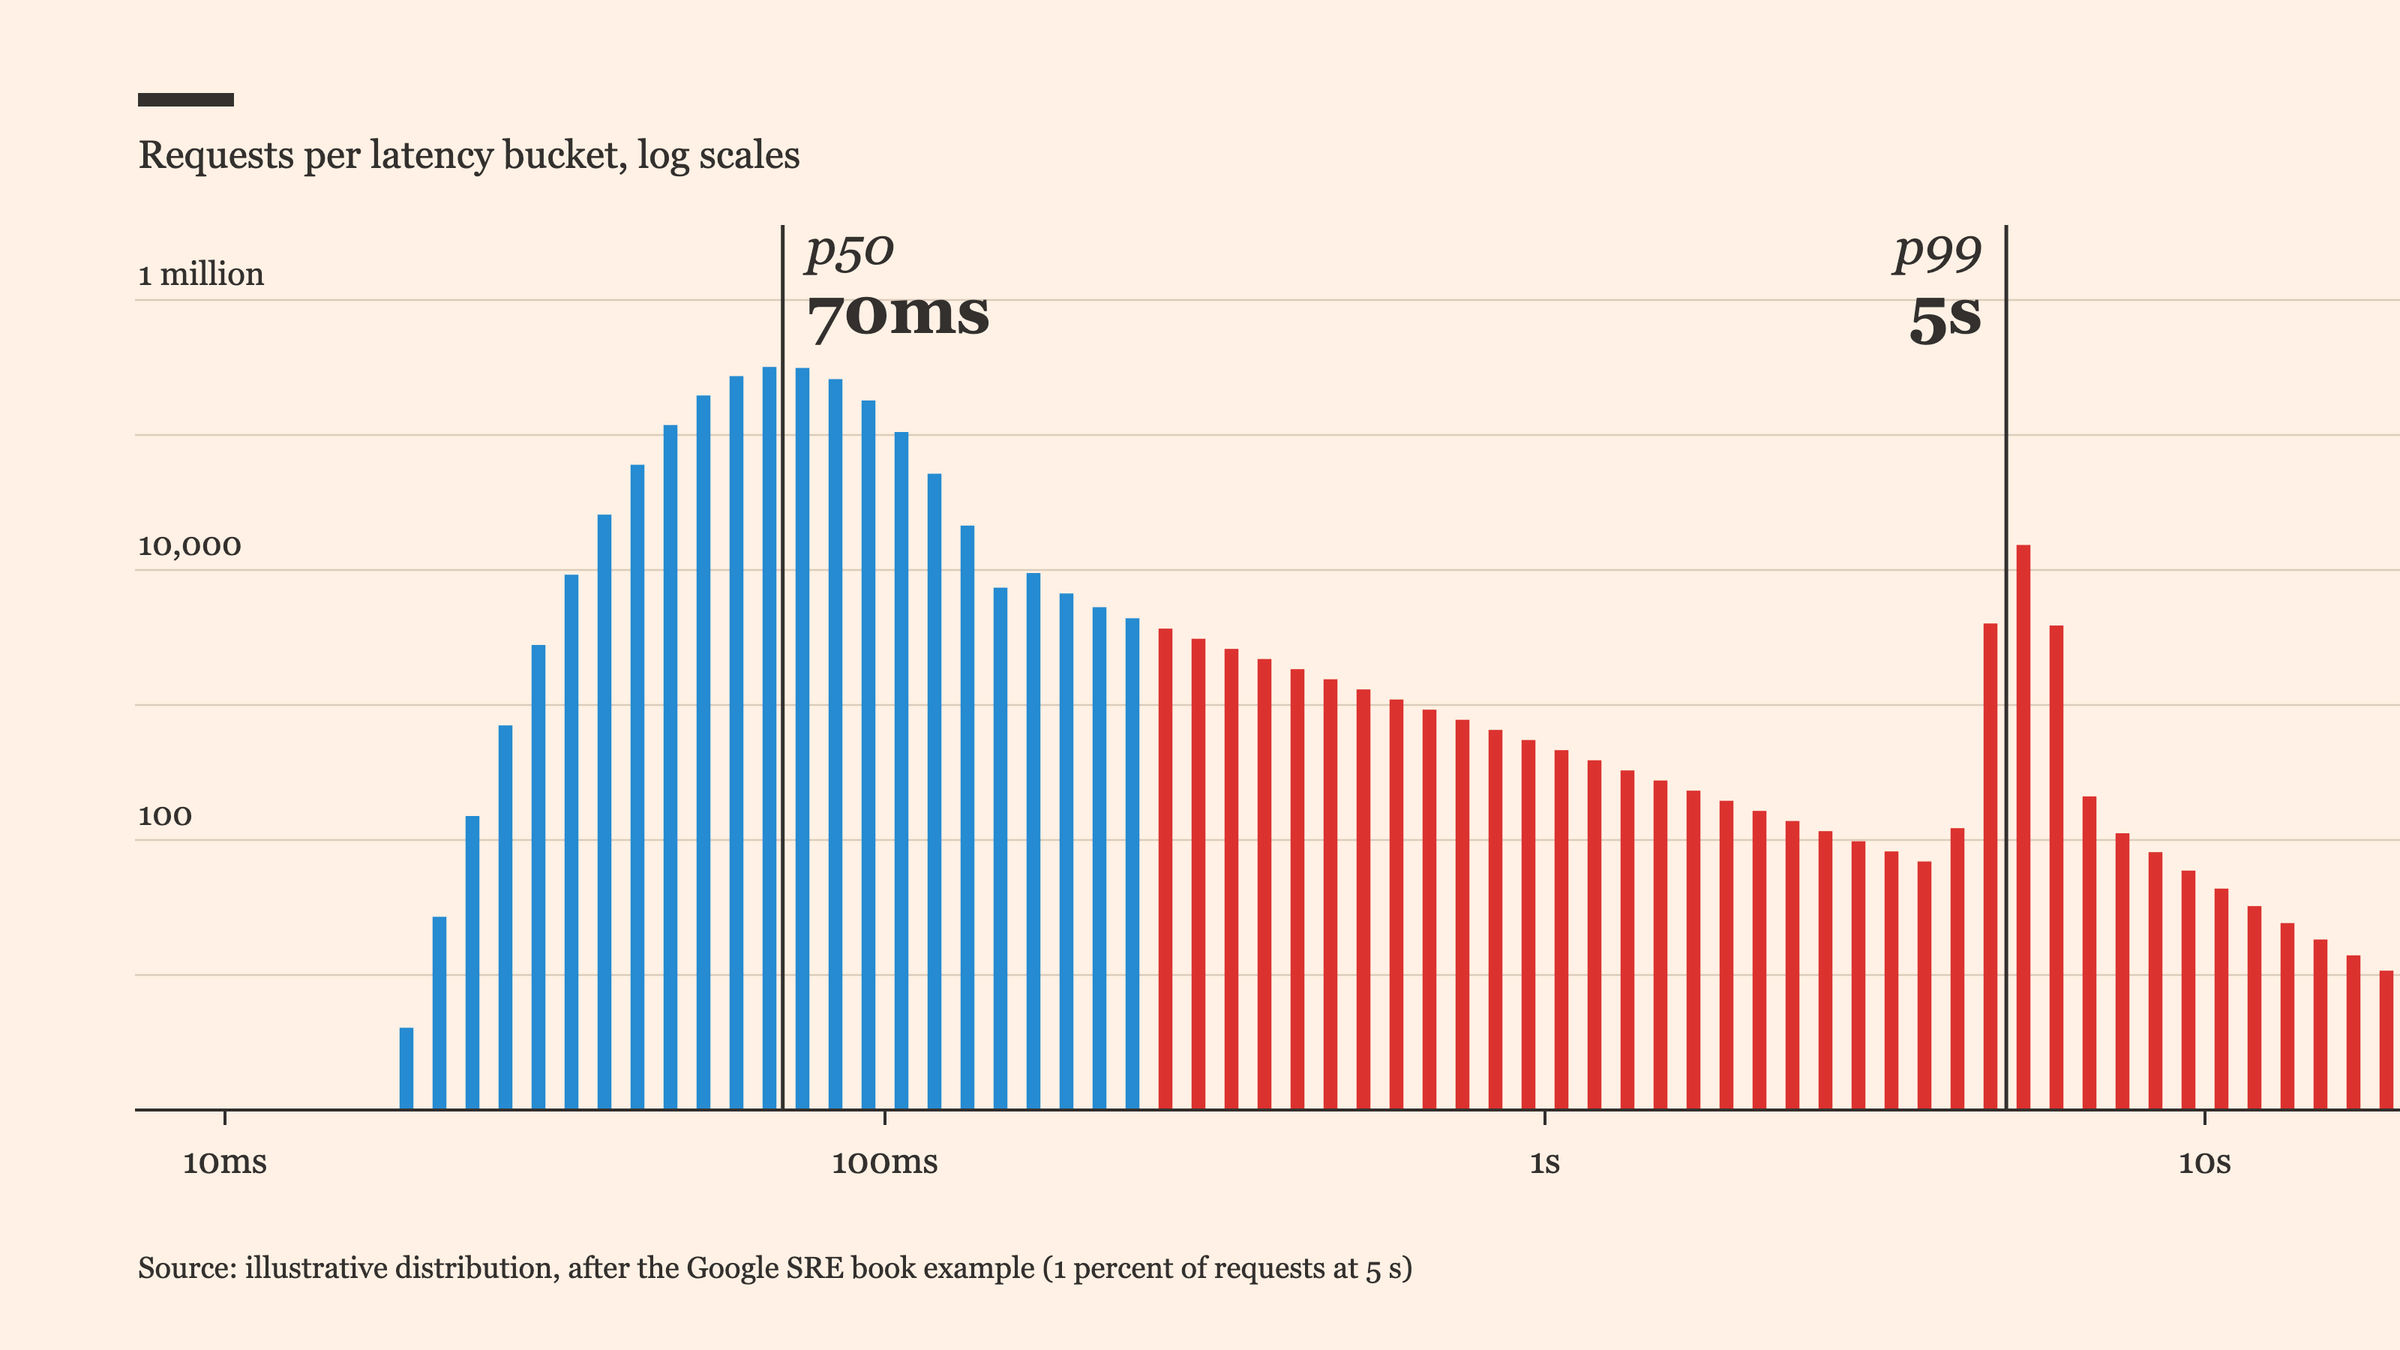
The wrong conclusion is "usage grew, so traffic grew." Sometimes it did. More often the request count is flat while the number of model calls per request, or tokens per call, drifted upward. An average cost per request hides this, because a few runaway agent runs or retry chains can double the total while barely moving the median.
This post gives you a fixed investigation order (the same one you would use for a cloud bill spike): feature first, then call pattern, then token type. It deliberately contains no savings percentage. Whether a change helps depends on your traffic, and the only number worth trusting is one you measure on it.
Why LLM API cost is unexpectedly high when the price did not change
Every provider bills some combination of input tokens, output tokens, and in some cases cached or batch-discounted variants of those. The shape of that billing is documented, and the exact rates change, so check the current pricing page for your provider rather than a blog post (this one included). What matters for diagnosis is the list of ways quantity can grow without anyone shipping a "cost" change.
- Longer prompts. A system prompt gains a paragraph, retrieval returns more passages, or a tool list grows. Every call pays for it.
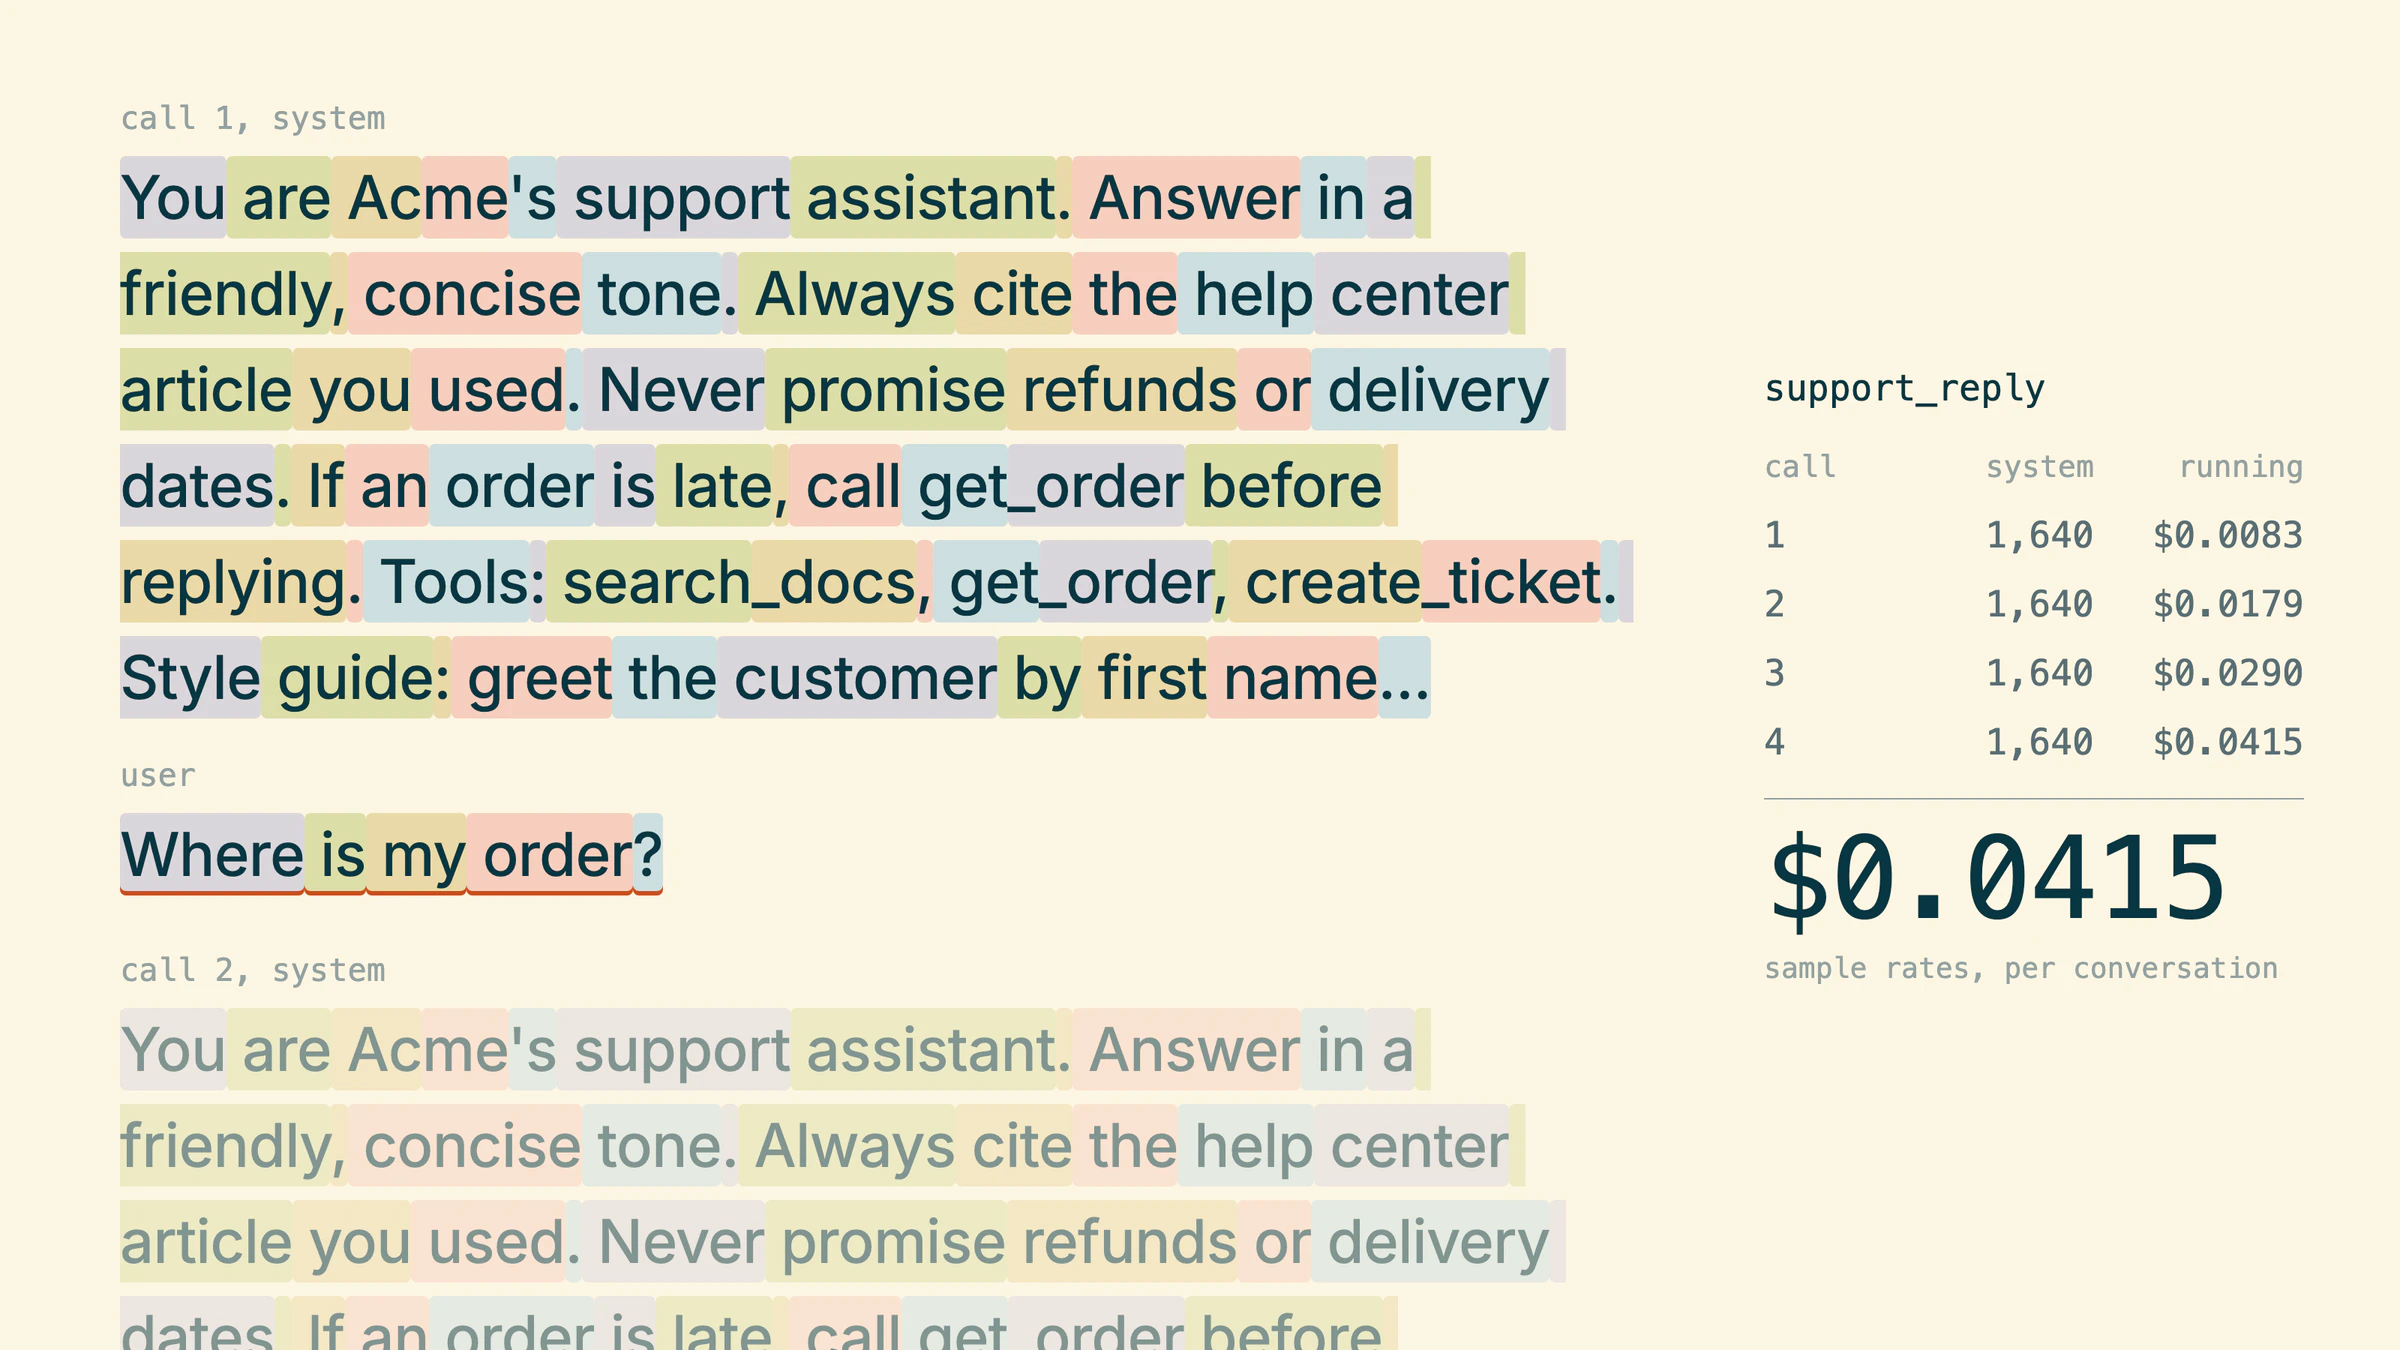
- Resent context. In a chat or agent, each turn typically resends the whole history. Cost per turn grows with conversation length, so total cost for a conversation grows faster than linearly in the number of turns.
- Multiplied calls. One user action fans out into a planner call, several tool-using steps, and a summarizer. A prompt change that causes one more step per action multiplies everything.
- Retries. A client-side timeout does not necessarily stop the work on the provider's side, so check your provider's documentation on how abandoned requests are billed before you assume a timed-out call was free. Retrying a request that failed for a non-transient reason spends another attempt on a call that can never succeed.
- Model defaults. A config change, an SDK upgrade, or a router rule moves a feature to a stronger and pricier model.
- Tokenizer changes. The same text can produce a different number of tokens on a different model generation. Anthropic's token counting documentation notes that newer models use a newer tokenizer and recommends recounting prompts against the model you plan to use instead of reusing old counts.
- Hidden tokens. Reasoning or thinking output counts toward output on providers that bill it, even when you never display it. Anthropic's docs, for example, expose the reasoning share of billed output tokens in a
thinking_tokensusage field (Anthropic: Extended thinking). Thinking blocks from earlier turns can also count toward input on some models, per the same token counting page.
Each of these is a quantity you can observe if you record it. None is visible in an aggregate dashboard that only shows dollars per day.
What to record on every model call
Accounting means one structured record per model call, not per user request. The fields below are enough to attribute almost any increase.
- Feature and route. A stable name for the product feature that triggered the call (for example
support_replyordoc_summary), plus the code path. - Request ID and parent ID. A correlation ID that ties all calls in one user action together, and a per-call ID.
- Model identifier as sent, and the version string the provider reports back.
- Token counts by type. Uncached input, cached input read, cached input written, output. Take these from the response
usageobject, not from your own estimate. - Attempt number and outcome. First try, retry 2, timeout, HTTP status, stop reason.
- Step index inside an agent loop, and the tool name if the call was a tool turn.
- Latency. Useful to spot a retry that was really a slow success.
- The provider's request ID, so you can reconcile with a support ticket. Anthropic's errors documentation notes that every response carries a
request-idheader for this purpose.
Normalizing token fields matters because providers do not agree on what a field means. Per Anthropic's prompt caching documentation, input_tokens counts only the tokens after the last cache breakpoint, and total input is the sum of cache_read_input_tokens, cache_creation_input_tokens, and input_tokens. OpenAI's prompt caching documentation describes cached_tokens as a field inside usage alongside a total input count. If you sum raw fields across vendors without normalizing, your dashboard will be wrong in a way that looks plausible.
// Illustrative: normalize two vendors' usage shapes into one record.
// Verify field names against the SDK version you run.
type CallRecord = {
  feature: string;
  requestId: string;       // one user action
  callId: string;          // one model call
  attempt: number;
  step: number;
  model: string;
  inputUncached: number;
  inputCacheRead: number;
  inputCacheWrite: number;
  output: number;
  status: "ok" | "timeout" | "http_error";
  httpStatus?: number;
  latencyMs: number;
};

// Anthropic-style usage: input_tokens EXCLUDES cached prefix tokens.
function fromAnthropicUsage(u: {
  input_tokens: number;
  cache_read_input_tokens?: number;
  cache_creation_input_tokens?: number;
  output_tokens: number;
}) {
  return {
    inputUncached: u.input_tokens,
    inputCacheRead: u.cache_read_input_tokens ?? 0,
    inputCacheWrite: u.cache_creation_input_tokens ?? 0,
    output: u.output_tokens,
  };
}

// OpenAI-style usage: input total INCLUDES cached tokens, so subtract.
function fromOpenAIUsage(u: {
  input_tokens: number;
  input_tokens_details?: { cached_tokens?: number };
  output_tokens: number;
}) {
  const cached = u.input_tokens_details?.cached_tokens ?? 0;
  return {
    inputUncached: u.input_tokens - cached,
    inputCacheRead: cached,
    inputCacheWrite: 0, // reported separately on some models; check docs
    output: u.output_tokens,
  };
}
What not to log
The cheapest way to get complete accounting is to log full prompts and completions. Do not do that by default. Prompts contain user content, and sometimes credentials, personal data, or client data you promised to keep out of logs. Token counts, hashes, lengths, and template IDs give you nearly all the attribution you need. If you need payload capture for debugging, make it a sampled, short-retention, access-controlled path that is off for sensitive features, and put redaction in front of it. Decide this before an incident, not during one.
Investigate in this order
- Find the feature. Group spend by feature and day, and compare the week the bill rose to the week before. If one feature explains most of the delta, stop looking at the others. If you have no feature label, that is your first finding: add the label and wait for a day of data, or work backward from API keys or workspaces if your provider lets you split them.
- Find the call pattern. For that feature, compare calls per request (fan-out), attempts per call (retries), and steps per run (loops). This is where multipliers live. A flat request count with a rising calls-per-request number is a loop or a prompt change, not traffic.
- Find the token type. Only now split input from output, and cached from uncached. Rising uncached input means a longer prompt, longer history, or a cache that stopped hitting. Rising output means longer generations, more reasoning, or a missing length cap.
- Look at the tail, not the mean. Compute the 95th and 99th percentile of tokens and calls per request. A handful of runaway runs can account for a large share of the increase.
- Check what changed. Match the start of the rise against deploys, prompt template edits, model config, SDK upgrades, and new customers. Records with a model and template version make this a query instead of an argument.
-- Illustrative (Postgres). Assumes a table llm_calls shaped like CallRecord.
-- Step 1-2: which feature moved, and is it traffic or a multiplier?
SELECT
  feature,
  date_trunc('day', created_at)                         AS day,
  count(DISTINCT request_id)                            AS requests,
  count(*)                                              AS model_calls,
  round(count(*)::numeric / count(DISTINCT request_id), 2) AS calls_per_request,
  round(avg(attempt)::numeric, 2)                       AS avg_attempt,
  sum(input_uncached + input_cache_read + input_cache_write) AS input_tokens,
  sum(output)                                           AS output_tokens
FROM llm_calls
WHERE created_at >= now() - interval '14 days'
GROUP BY feature, day
ORDER BY feature, day;

-- Step 4: the tail. Per-request totals, then percentiles.
WITH per_request AS (
  SELECT feature, request_id,
         count(*) AS calls,
         sum(input_uncached + input_cache_read + input_cache_write + output) AS tokens
  FROM llm_calls
  WHERE created_at >= now() - interval '7 days'
  GROUP BY feature, request_id
)
SELECT feature,
       percentile_cont(0.5)  WITHIN GROUP (ORDER BY tokens) AS p50_tokens,
       percentile_cont(0.99) WITHIN GROUP (ORDER BY tokens) AS p99_tokens,
       max(calls)                                            AS max_calls
FROM per_request
GROUP BY feature;
If the p50 is flat and the p99 or max calls per request doubled, you have a runaway pattern. The next section is about those.
Retries and tool loops are multipliers
Two failure modes account for a disproportionate share of surprise bills, because they turn one logical action into many billed calls.
Retries that bill
A timeout on your side does not cancel the work on the provider's side. If your client gives up at a deadline and retries, you can pay for both attempts. Anthropic's errors documentation lists which statuses are which: a 500 and an overloaded 529 are transient, a 400 means the request itself is malformed, and a 429 can be a rate limit or, in the case of a monthly spend cap, one that has no retry-after header and keeps failing until access resumes. Retrying the last case on a loop does not recover anything.
The same page notes that the official SDK retries transient failures with exponential backoff, twice by default, honoring retry-after. That default is a multiplier you may have stacked on top of your own retry layer. If your application wraps the SDK in another retry loop, a single outage can produce attempts multiplied by attempts. Record the attempt number, and decide in one place where retries live. The retry storm post covers backoff and jitter in detail.
Rules that keep retries from becoming a cost line:
- Retry only statuses that can change on a second try. Do not retry 400-class validation errors or an exhausted spend cap.
- Set a per-user-action retry budget, not just a per-call one.
- Use a deadline that fits the longest reasonable generation, and stream long outputs so a dropped connection is detected early. The same errors page recommends streaming or batch for very long requests.
Loops that do not end
An agent that calls tools until it decides it is done has no natural upper bound. A tool that returns an unhelpful error, a model that keeps re-planning, or two agents handing work back and forth will keep billing until something stops them. Because each step typically resends the growing history, the cost per step rises as the loop continues.
Set explicit limits and make them observable:
- A maximum number of steps per run, and a maximum total token budget per run.
- A repeated-action detector: the same tool with the same arguments three times is a loop.
- A distinct stop reason in your records (
step_limit,budget_limit,done), so you can count how often each limit fires.
Fixes and where each one backfires
Pick fixes by what the diagnosis found, not by a list of tips. Each of these changes the shape of the bill. None has a universal size, and each has a way to hurt you.
Cap steps and context
A step limit contains a runaway agent. It also cuts off a legitimate long task, which now fails or returns a partial answer. Choose limits from the observed distribution of successful runs, route limit hits to a fallback (summarize and ask the user), and alert on the rate of limit hits. A rising rate usually means the limit is too tight or a tool broke.
Trimming context saves input tokens, and it removes information the answer may have needed. If you truncate history, summarize it instead of cutting it blindly, and test the specific questions that depend on early turns.
Cache a shared prefix
Both major providers document prefix caching: the system reuses processed tokens when a later request starts with the same prefix. Anthropic's documentation describes marking a breakpoint with cache_control, a default short lifetime with an optional longer one, a minimum prefix length below which nothing is cached (with no error), and a billing shape where writing to the cache costs more than normal input while reading from it costs much less. OpenAI's documentation describes the same idea with exact-prefix matching and a minimum prompt length, and advises putting stable instructions and reference material first and changing content last.
What this means for you:
- It helps when many requests share a large, identical prefix: a long system prompt, a tool list, a reference document.
- It does nothing for unique user text.
- Anything that changes before the breakpoint breaks reuse. Anthropic documents that changing tool definitions invalidates the whole cache, and that other settings invalidate parts of it. A timestamp or user name near the top of a system prompt defeats the cache on every call.
- A prefix that is written but rarely read is a net loss, because the write costs more than plain input.
- Never put one tenant's private content in a prefix that another tenant's requests can match. Keep shared prefixes to content that is safe to share, and check your provider's cache isolation rules.
Verify it worked by watching the cache-read share of input tokens in your records rise, and the uncached share fall, for that feature. If cache reads stay at zero, the prefix is below the minimum, is not byte-identical, or the entry expires before the next request.
Batch work nobody waits for
Batch APIs process requests asynchronously at a discount, and they run in a separate capacity pool. Anthropic's Message Batches documentation says most batches finish in under an hour. OpenAI's documentation describes a fixed 24-hour completion window and a separate rate limit pool, so batch jobs do not compete with interactive traffic for quota. Both suit evaluations, classification of large datasets, and backfills. Neither suits anything a user is waiting on. Moving an overnight re-embedding or nightly summarization job to batch changes its price and removes it from your interactive rate limits. The trade-off is turnaround time and a more complex failure path: you poll for results and handle partial failures per item.
Use a cheaper model where it is enough
Routing steps that do not need the strongest model, such as classification, extraction with a strict schema, or routing itself, to a smaller one cuts price per call. The risk is a higher task failure rate and more human cleanup, which has its own cost. Measure task success on a labeled sample for each routed step before you move traffic, and keep the stronger model as a fallback for low-confidence cases. A cheaper model that needs more retries or longer prompts to reach the same quality may not be cheaper in total.
A checklist for Monday
- Add a feature label and a correlation ID to every model call if either is missing.
- Record the four token types (uncached input, cache read, cache write, output), the attempt number, the step index, and the model, normalized across providers.
- Run the feature-by-day query and find the feature that moved.
- Compare calls per request and attempts per call before you look at tokens.
- Check the tail: p99 tokens and max calls per request.
- Set a step limit and a token budget per run, and count how often they fire.
- List which errors your code retries and remove the ones that cannot succeed.
- Check the stability of your longest shared prefix, and see whether cache reads show up.
- Move offline jobs to a batch API where the turnaround fits.
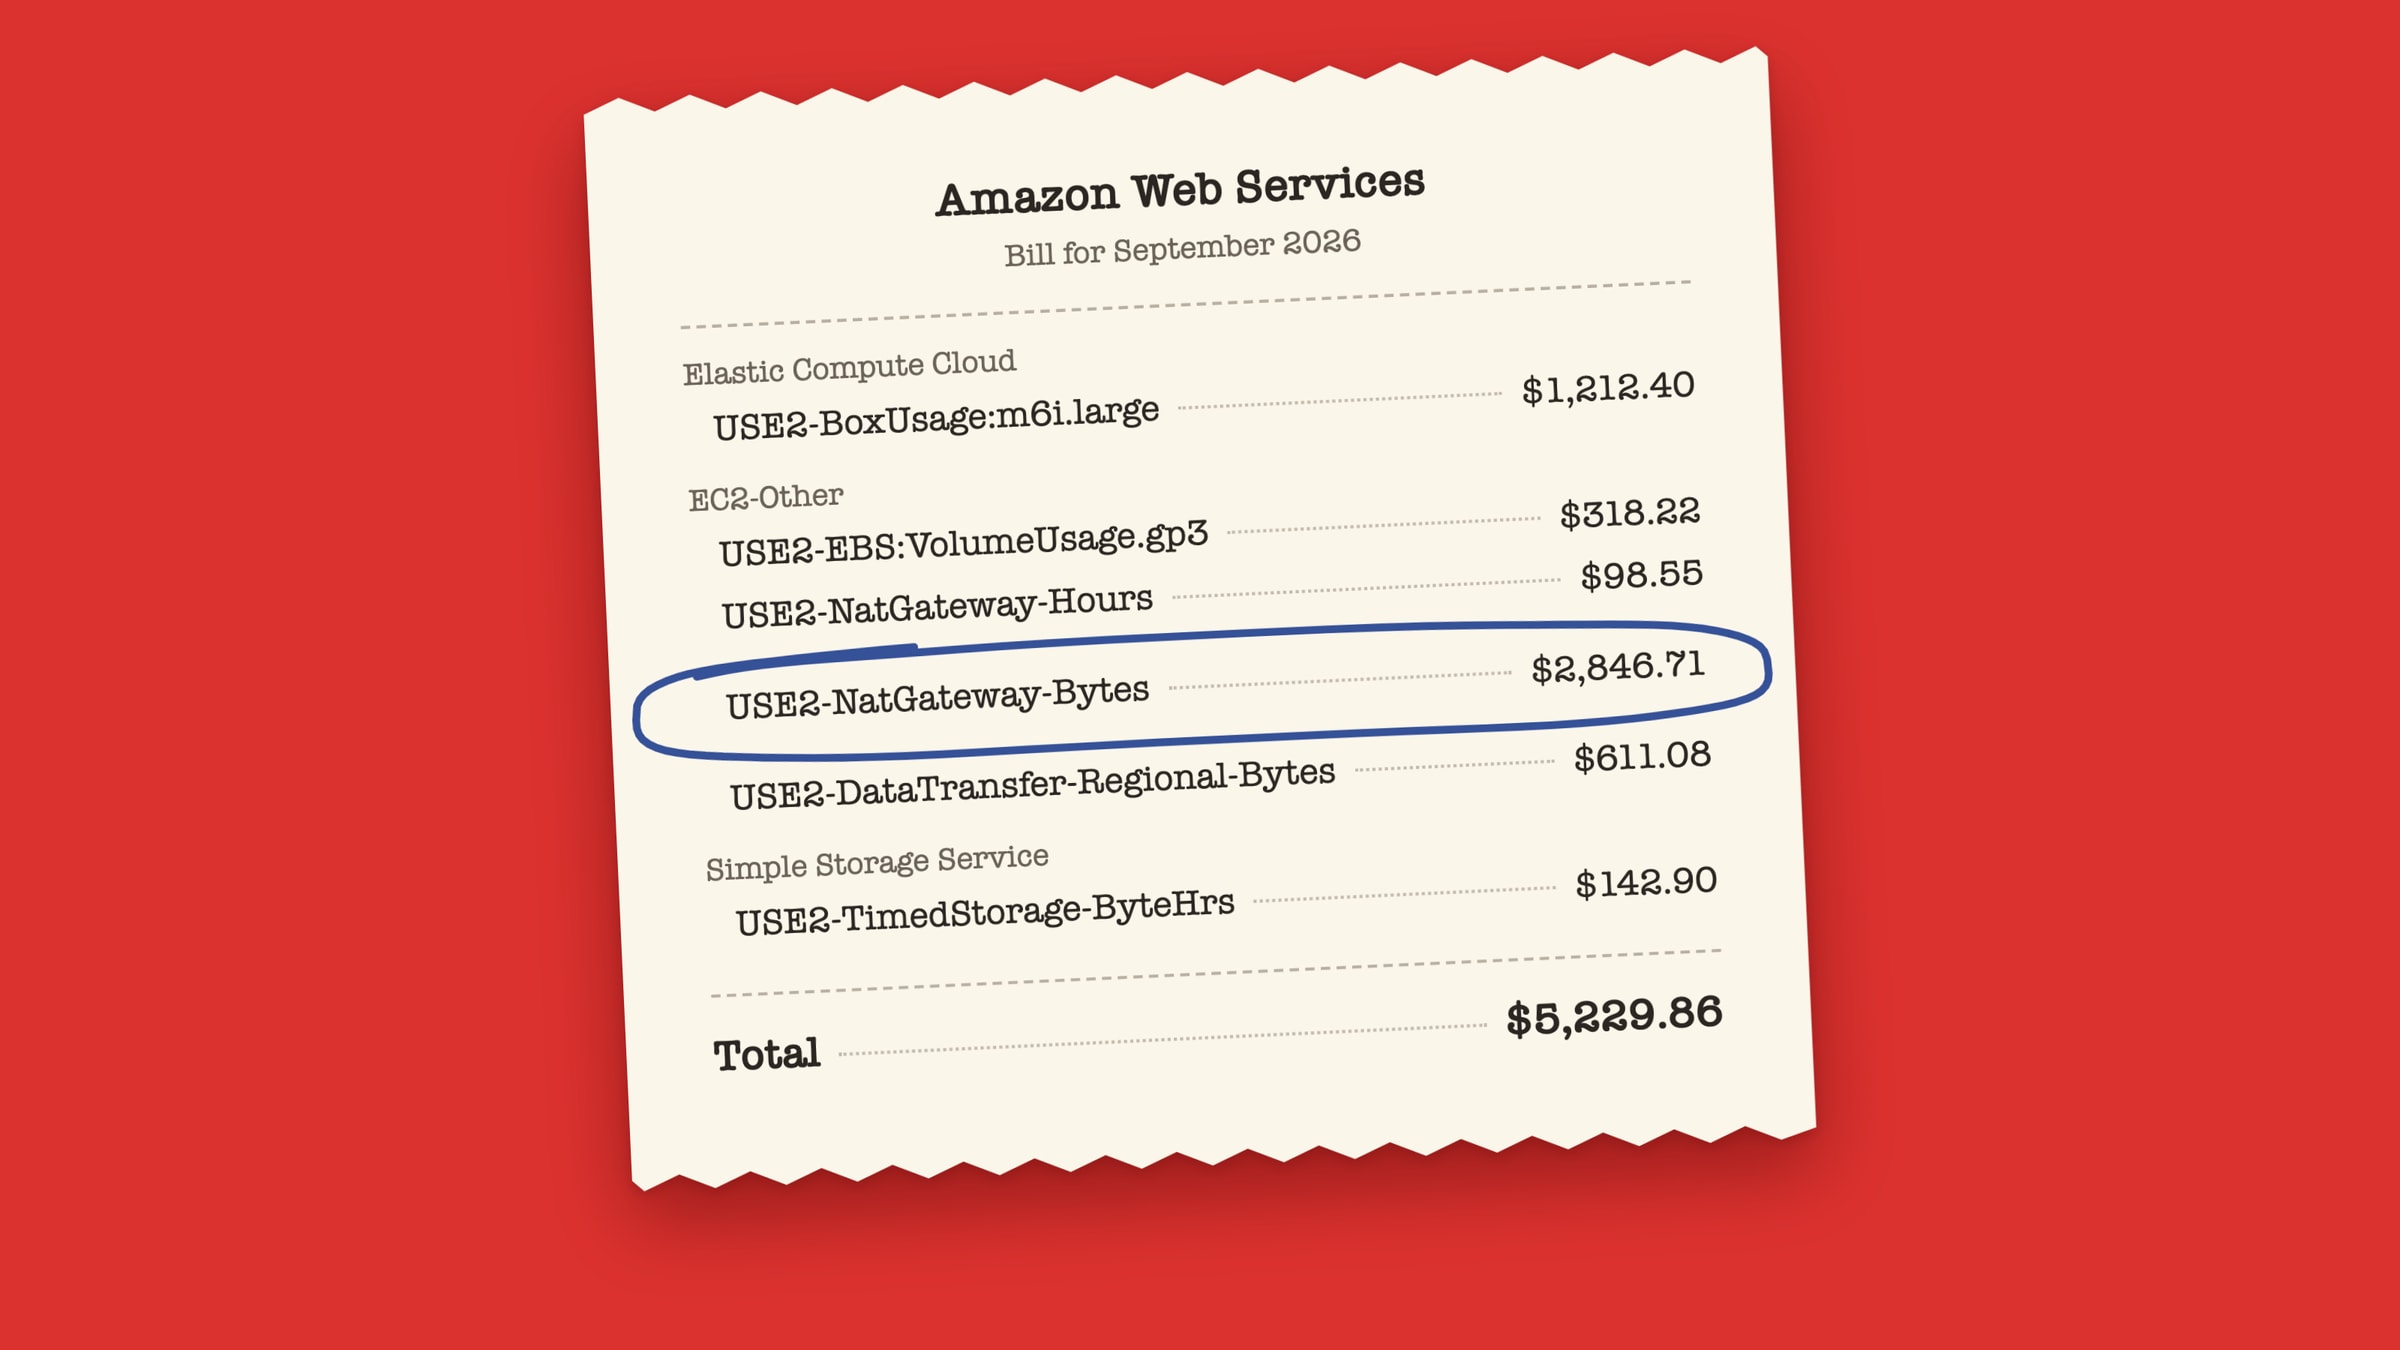
- Set a spend alert per feature, not just per account. Provider-side usage and cost views are coarse tools, in the same way AWS describes Cost Explorer as a way to identify areas that need further inquiry. Your own per-call records are the thing that explains why.
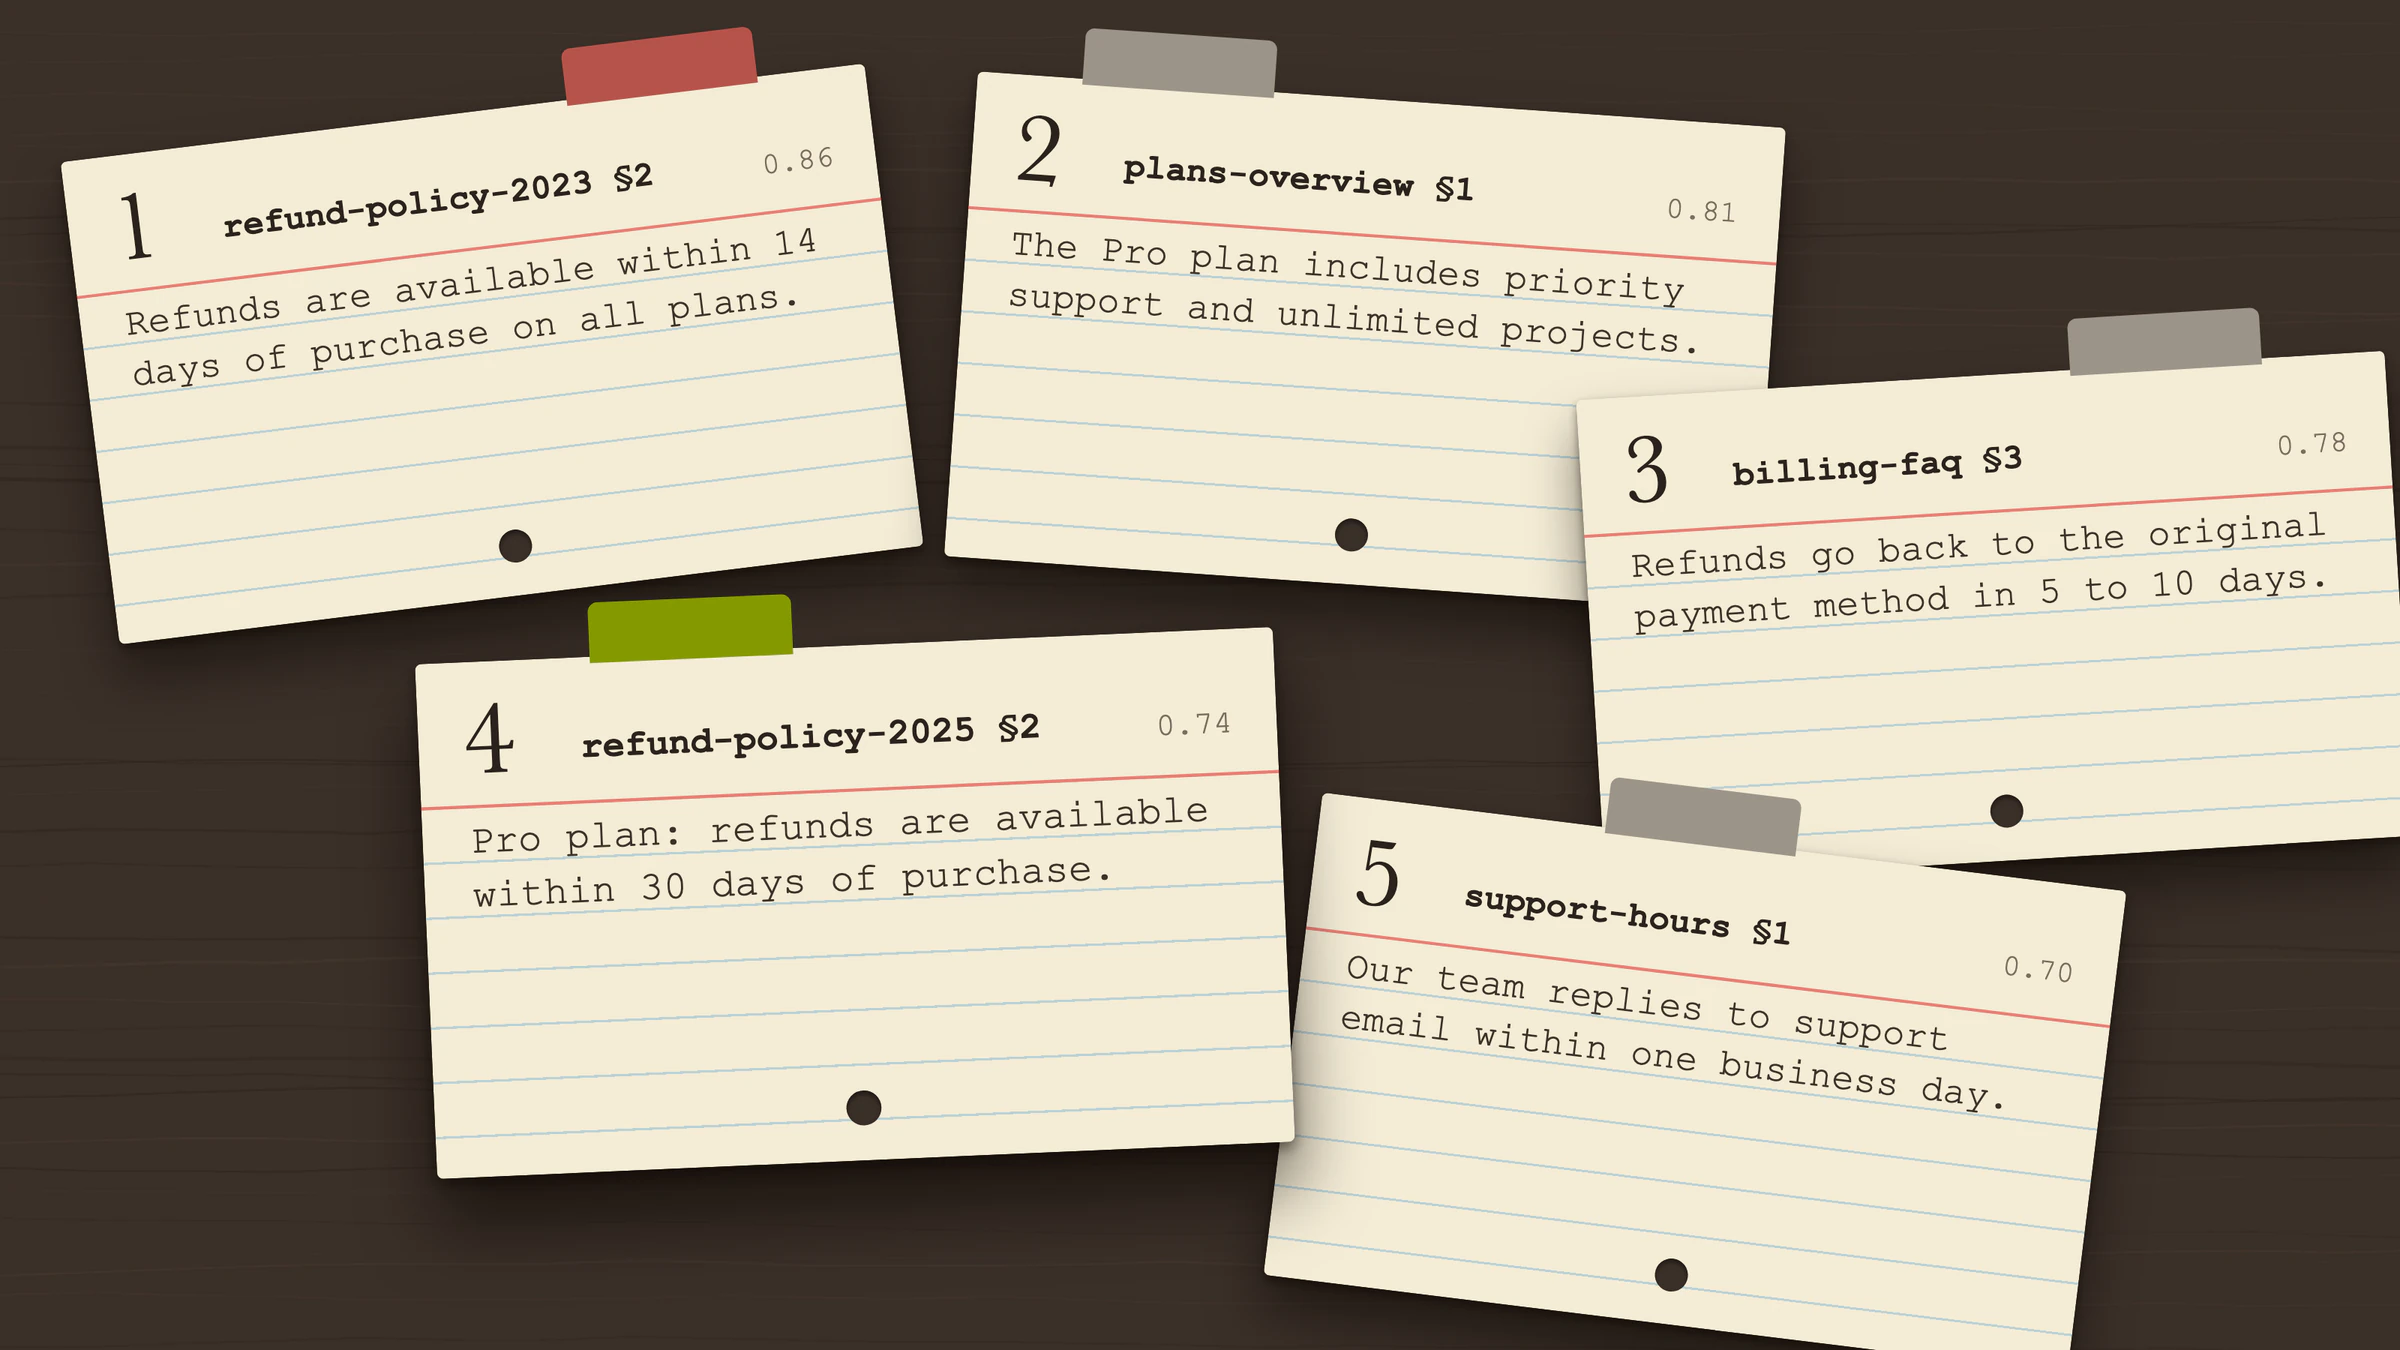
If your feature uses retrieval, a bloated prompt is often a retrieval symptom: too many passages are stuffed in because the right one is not ranked first. See RAG retrieval evaluation for how to check that before you pay to send more context.
Sources
- Anthropic: Prompt caching (usage fields, breakpoints, minimum prefix, lifetime, invalidation, billing shape)
- OpenAI: Prompt caching (exact prefix matching, minimum length, cached token field, structuring advice)
- Anthropic: Message Batches (asynchronous processing, typical turnaround, discount)
- OpenAI: Batch API (24-hour window, separate rate limit pool)
- Anthropic: API errors (status meanings, SDK retry defaults, request ID, spend cap 429, streaming for long requests)
- Anthropic: Extended thinking (reasoning tokens reported within billed output)
- Anthropic: Token counting (counts are estimates, newer tokenizer, thinking tokens in input)
- AWS: Analyzing your costs with Cost Explorer (cost tooling as a pointer for further inquiry)
Written by
Azeem Subhani
Senior Full-Stack & AI Application Engineer
I build SaaS, booking, payment, real-time, and AI-enabled web platforms with React, Next.js, Node.js, NestJS, Django, PostgreSQL, and AWS. My work includes Stripe payment systems, white-label booking flows, real-time collaboration, RAG workflows, and developer automation.