High Cardinality Metrics: When OpenTelemetry Overflow Silences Alerts
OpenTelemetry cardinality overflow keeps totals right but undercounts breakdowns, so error alerts can go quiet. Learn to detect, prevent, and bound it.
Azeem Subhani · · 9 min read
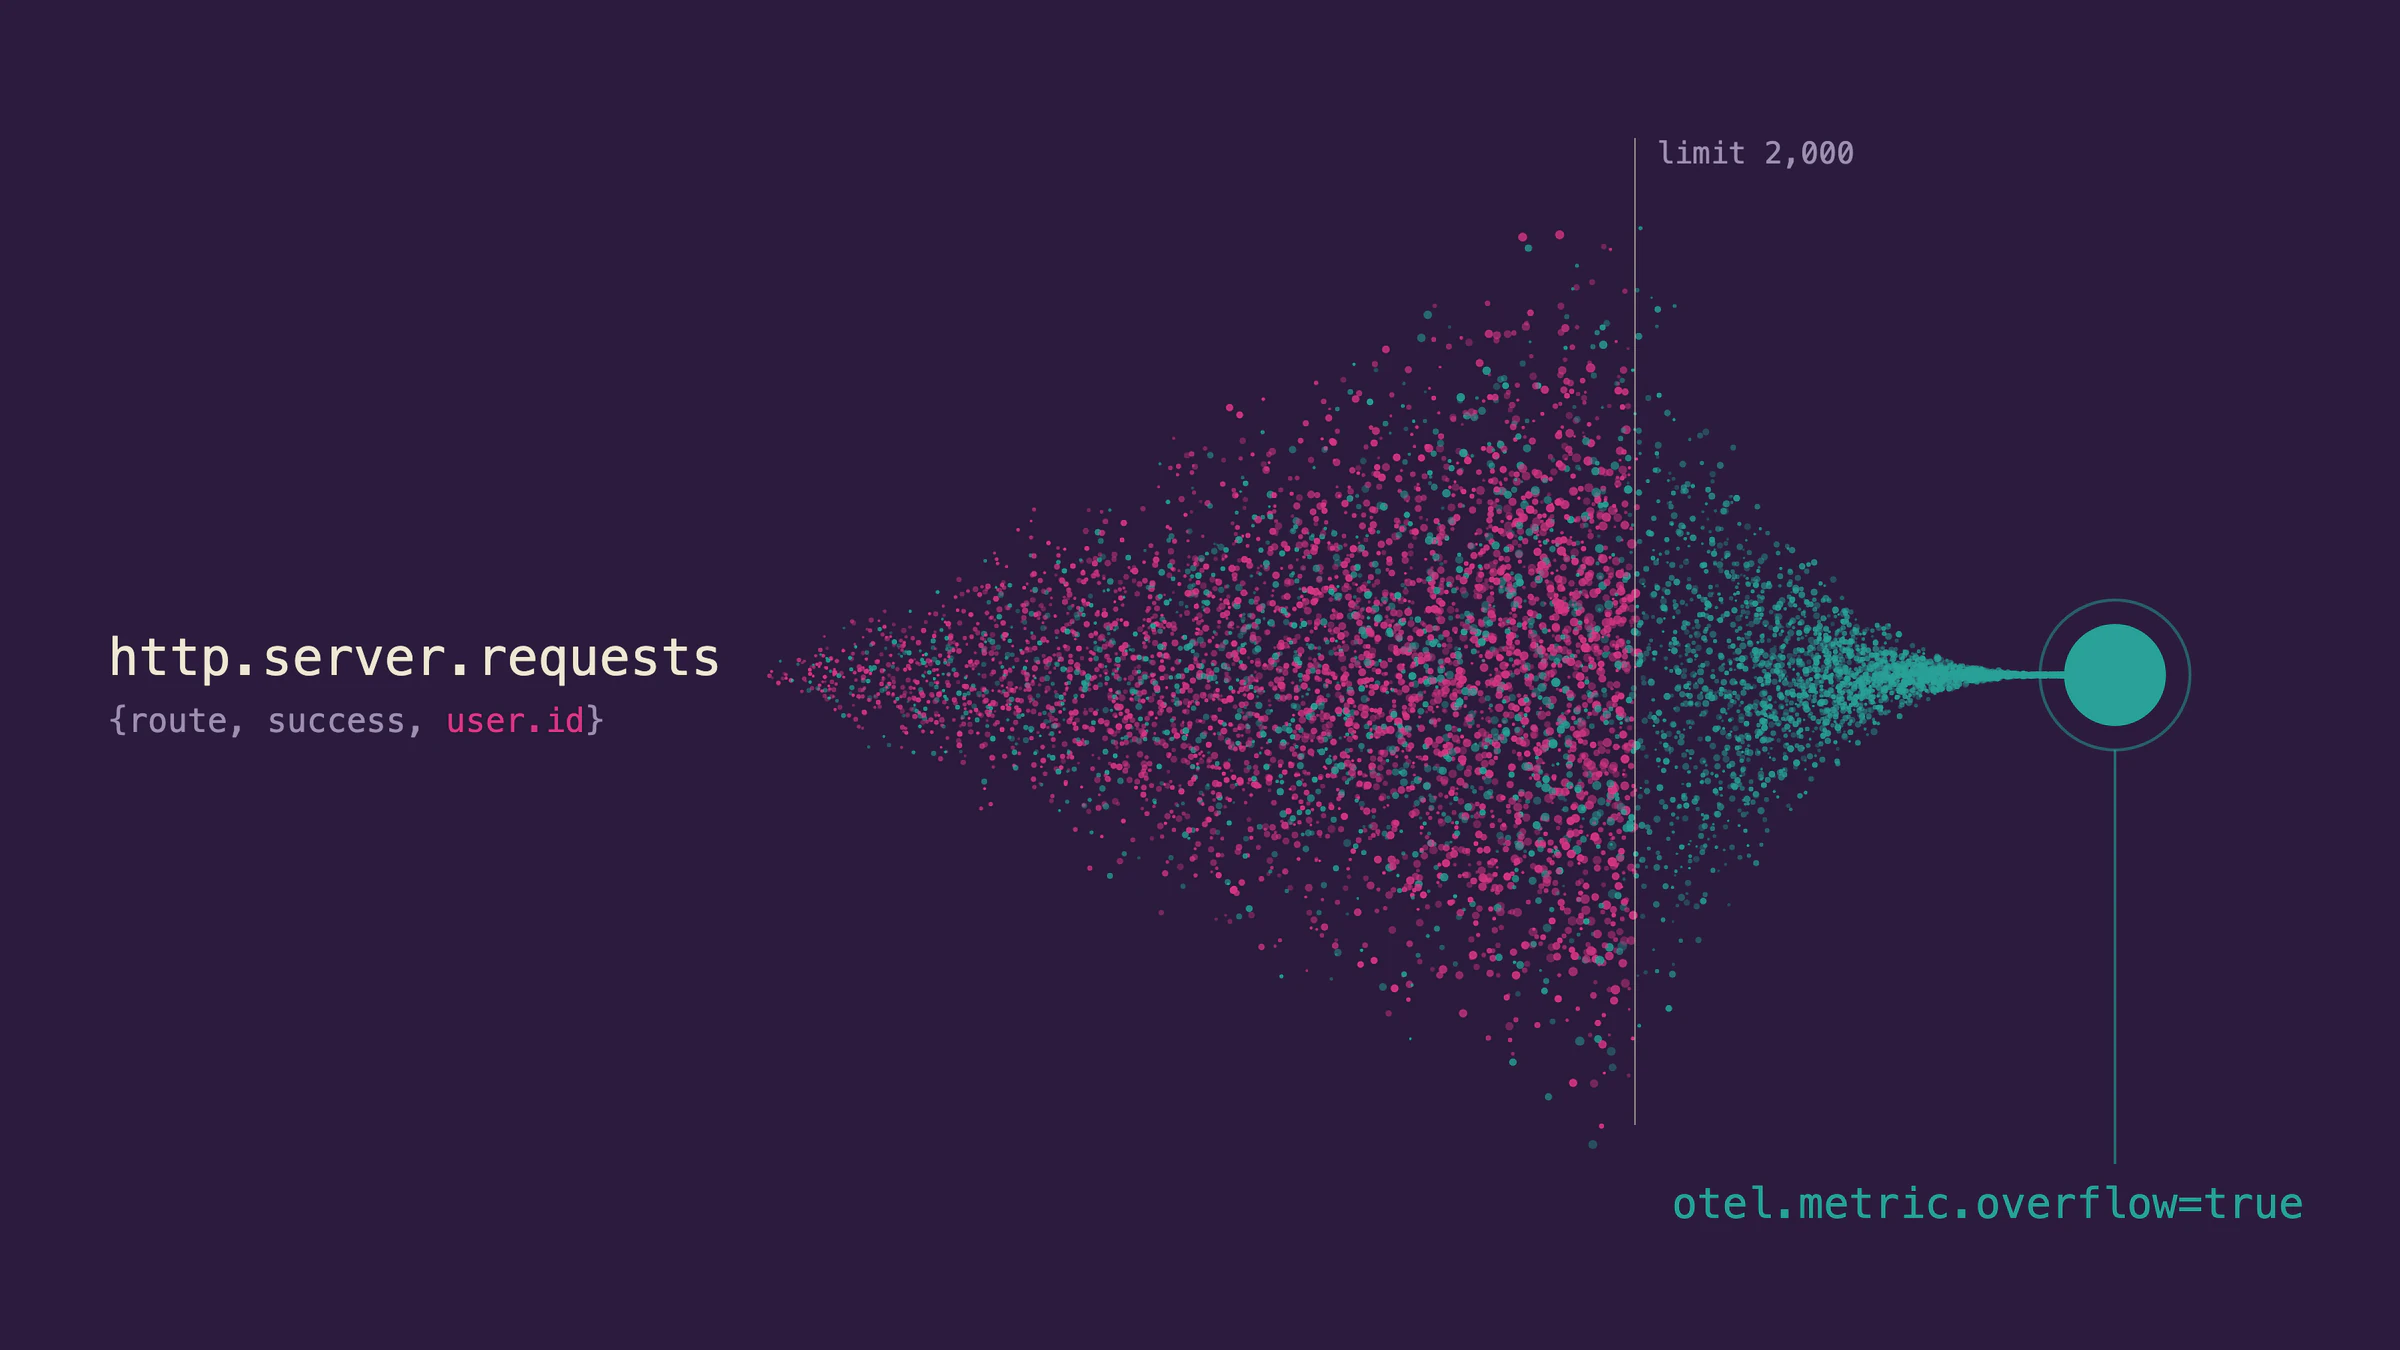
An error-rate alert stops firing during an incident. The request-count graph looks normal, the total is plausible, and nobody is paged. The cause may be high cardinality metrics: one attribute grew without bound, the OpenTelemetry SDK hit its cardinality limit, and every query that filtered by an attribute started undercounting while the total stayed correct. This failure is quieter and more dangerous than the invoice that usually motivates cardinality advice.
This post explains how overflow works according to the OpenTelemetry documentation, why a low-cardinality attribute like success can be lost along with the bad one, how to find out whether it is already happening, and how to prevent and bound the problem without deleting the breakdowns people rely on.
What cardinality actually measures
The cardinality of a metric is the number of unique attribute combinations reported for it, as defined in the OpenTelemetry metrics concepts. It is a property of combinations, not of request volume. A service handling a million requests per second with three routes and two outcomes has six combinations. A service handling ten requests per second that puts a user id on every measurement can have as many combinations as it has users.
Multiplication is the trap. Each attribute you add multiplies the possible combinations by its number of distinct values. The OpenTelemetry cardinality blog post gives a sizing example: 100 known routes times 5 methods times 2 success values is 1,000 combinations (Cardinality limits in OpenTelemetry). That is fine. Replace the route template with the raw URL, and the product has no ceiling.
The SDK keeps one aggregation (a counter total, a histogram's buckets) per unique combination, in memory, for each metric stream. Backends do the same on storage: Prometheus documentation says every unique label combination is a new time series and warns against storing dimensions such as user ids, email addresses, or other unbounded sets of values in labels (Metric and label naming, Prometheus).
What overflow does to your data
To protect process memory, the SDK caps the number of combinations per metric stream. According to the OpenTelemetry blog post and the metrics SDK specification, the default limit is 2,000 combinations (Metrics SDK specification). When it is exceeded, measurements are not discarded. They are folded into a single overflow data point carrying the attribute otel.metric.overflow=true, and the original attributes are removed from that point.
The consequences, in the documentation's own terms:
- Totals stay correct, but attribute breakdowns can undercount. Any query that filters or groups by a measurement attribute can miss values folded into overflow.
- Every measurement attribute is affected. If a combination overflows, all of its attributes, even a low-cardinality boolean such as success, are removed from the exported overflow point and become unreliable for filtering.
- Resource and instrumentation scope attributes are not counted toward the limit and remain queryable during overflow, per the metrics concepts page.
That second point is the one most posts miss. The attribute that leaked is not the only casualty. Consider a counter named http.server.requests with attributes route, success, and user.id. The user id is the leak. Once combinations overflow, the overflow point has no user.id, no route, and no success. An alert written as the count where success is false, divided by the total, now has a numerator that excludes everything that overflowed and a denominator that may or may not include it, depending on how the query is written. The ratio drifts toward zero. The dashboard total is right; the alert is wrong.
Why the alert goes quiet
Take a typical error-rate rule:
# Error ratio per route. Illustrative metric names after OTLP-to-Prometheus translation.
sum by (route) (rate(http_server_requests_total{success="false"}[5m]))
/
sum by (route) (rate(http_server_requests_total[5m]))
After overflow begins, new failures are recorded under the overflow point, which has neither success nor route. The numerator misses them. The denominator, grouped by route, drops them too, so overflow traffic simply vanishes from every per-route view. The only query that still sees it is the ungrouped total. A route can be failing hard and show a healthy ratio, because the failing requests are in a series the query never selects.
Temporality changes how long it lasts
The metrics concepts page notes that temporality determines how quickly you recover. With delta temporality, the SDK resets state each collection cycle, so only combinations active within the cycle count toward the limit. With cumulative temporality, state persists across cycles: once the limit is reached, new combinations overflow until the process restarts. A slow leak under cumulative temporality therefore degrades gradually and silently, and a deploy that restarts processes appears to fix it for a while.
The SDK specification also says that for cumulative synchronous instruments the SDK must retain previously observed attribute sets, so the early combinations keep their breakdown and the late ones are lost. Which services and routes survive is accidental: whichever appeared first.
Diagnose whether it has already happened
- Query for the overflow marker. In OTLP, the attribute is
otel.metric.overflowwith value true. Prometheus-style backends typically translate attribute dots to underscores, so the label usually appears asotel_metric_overflow. Confirm the exact name your pipeline produces (this depends on your translation settings and is an assumption here). - Compare totals against breakdowns. Sum the metric with no filter, then sum it grouped by the attribute you alert on. If the grouped sum is lower than the total over the same window, something is outside the breakdown.
- Count active series per metric. On the backend, list the metrics with the most series. A metric sitting near the SDK limit per process (default 2,000) is a candidate.
- Find the guilty attribute. For the suspect metric, count distinct values of each attribute. The one with thousands of values is the leak. Raw URLs, session ids, user ids, request ids, and unbounded error strings are the usual suspects, matching the OpenTelemetry post's list.
- Check recent changes. Often an instrumentation upgrade or a new middleware started recording a path or message as an attribute. Check the diff of attribute sets, not just the code that records the metric.
# Is any process currently overflowing? Label name depends on your translation (assumed).
sum by (service_name, __name__) (
  {otel_metric_overflow="true"}
)
If this returns data for a metric you alert on, treat the alert as untrustworthy until fixed.
Prevent it at the source
Keep attributes bounded by design
Only record attributes whose value set you can enumerate or cap. The HTTP semantic conventions are explicit about one common offender: the http.route attribute must be the matched route template with dynamic segments replaced by placeholders, and the raw URI path cannot substitute for it (HTTP metrics semantic conventions). If your framework does not expose a route template, omit the attribute rather than use the path.
Practical rules:
- Route templates, HTTP method, status class (2xx, 4xx, 5xx), and a small fixed set of outcomes are safe.
- Error types should be an enumerated code or exception class, not a message string.
- Tenants are only safe if the tenant count is bounded and you have budgeted for it. Otherwise bucket them by plan or tier.
- Ids belong on spans and logs, not on metrics.
Filter attributes with views
Views let you decide which attributes a metric reports, and the SDK specification states that cardinality limit enforcement happens after view-based attribute filtering. That ordering is useful: you can strip a bad attribute from an instrument you do not own, such as one emitted by auto-instrumentation, before it counts toward the limit. The Java documentation shows the shape (Java SDK views, OpenTelemetry):
// Keep only the listed attribute keys for one instrument.
SdkMeterProviderBuilder builder = SdkMeterProvider.builder();
builder.registerView(
    InstrumentSelector.builder().setName("http.server.request.duration").build(),
    View.builder()
        .setAttributeFilter(Set.of("http.request.method", "http.route", "http.response.status_code"))
        .build());

// Or set a limit for a specific instrument.
builder.registerView(
    InstrumentSelector.builder().setName("http.server.active_requests").build(),
    View.builder().setCardinalityLimit(100).build());
The documentation also warns that if two matching views each change a different property, you get two metric streams, not one combined change. Use narrow selectors and check the output.
Move the detail to traces
When you need the user id, use a span attribute. An exemplar can also attach the filtered-out attributes and trace ids to a sampled measurement, which preserves a path from an aggregate to a specific request without creating a series per user (Metrics SDK, exemplars). The cost moves to tracing: per-request detail is more expensive, so you sample, and sampling must keep failures. Head sampling decides before a trace finishes and cannot guarantee that errors are kept; tail sampling can keep error and slow traces but needs a stateful, resourced component (Sampling, OpenTelemetry).
Alert on overflow, and show it on dashboards
Prevention fails eventually, so make failure visible.
- Page or ticket on overflow for critical metrics. The OpenTelemetry post recommends monitoring continuously and alerting when overflow appears on critical metrics, and treating overflow as a signal to inspect the metric, not as a reason to raise the limit automatically.
- Show the overflow share on the dashboard. A small panel that plots overflow-point traffic next to the breakdown tells readers the split is incomplete. Without it, a viewer sees a clean chart with missing data.
- Pair breakdown alerts with a total-based fallback. An alert on the overall error ratio is immune to this failure because totals stay correct. It is less precise, but it still fires.
# Illustrative Prometheus alerting rules. Label names depend on your OTLP translation.
groups:
  - name: otel-cardinality
    rules:
      - alert: MetricOverflowActive
        expr: sum by (service_name) (rate({otel_metric_overflow="true"}[10m])) > 0
        for: 10m
        labels:
          severity: ticket
        annotations:
          summary: "Cardinality overflow on {{ $labels.service_name }}"
          description: "Breakdown queries for this service's metrics undercount until the leaking attribute is removed."
Validate the rule before relying on it: overflow points are only visible if the exporter sends them as a series your query can select, and some pipelines drop or relabel unknown labels. Test the rule by deliberately generating overflow in a staging service.
Choosing the fix: trade-offs
- Fewer attributes gives cheaper, safer metrics and coarser dashboards. Someone's favorite breakdown will disappear. Ask who uses it before removing it, and offer the trace-based replacement.
- Raising the limit protects a legitimate dimension and also lets a leak grow further before it is noticed. Raise it only after you have enumerated the real combinations (routes times methods times outcomes) and confirmed the number is stable. For delta temporality, estimate active combinations per cycle, not total population, as the OpenTelemetry post suggests.
- Dropping or normalizing the offending attribute restores the metric immediately but deletes history that used it. Normalize (template the route, bucket the tenant) when the dimension still has value.
- Sampling traces retains detail at a higher cost per request. Make sure the policy keeps failures and slow requests, or you lose the evidence you moved there.
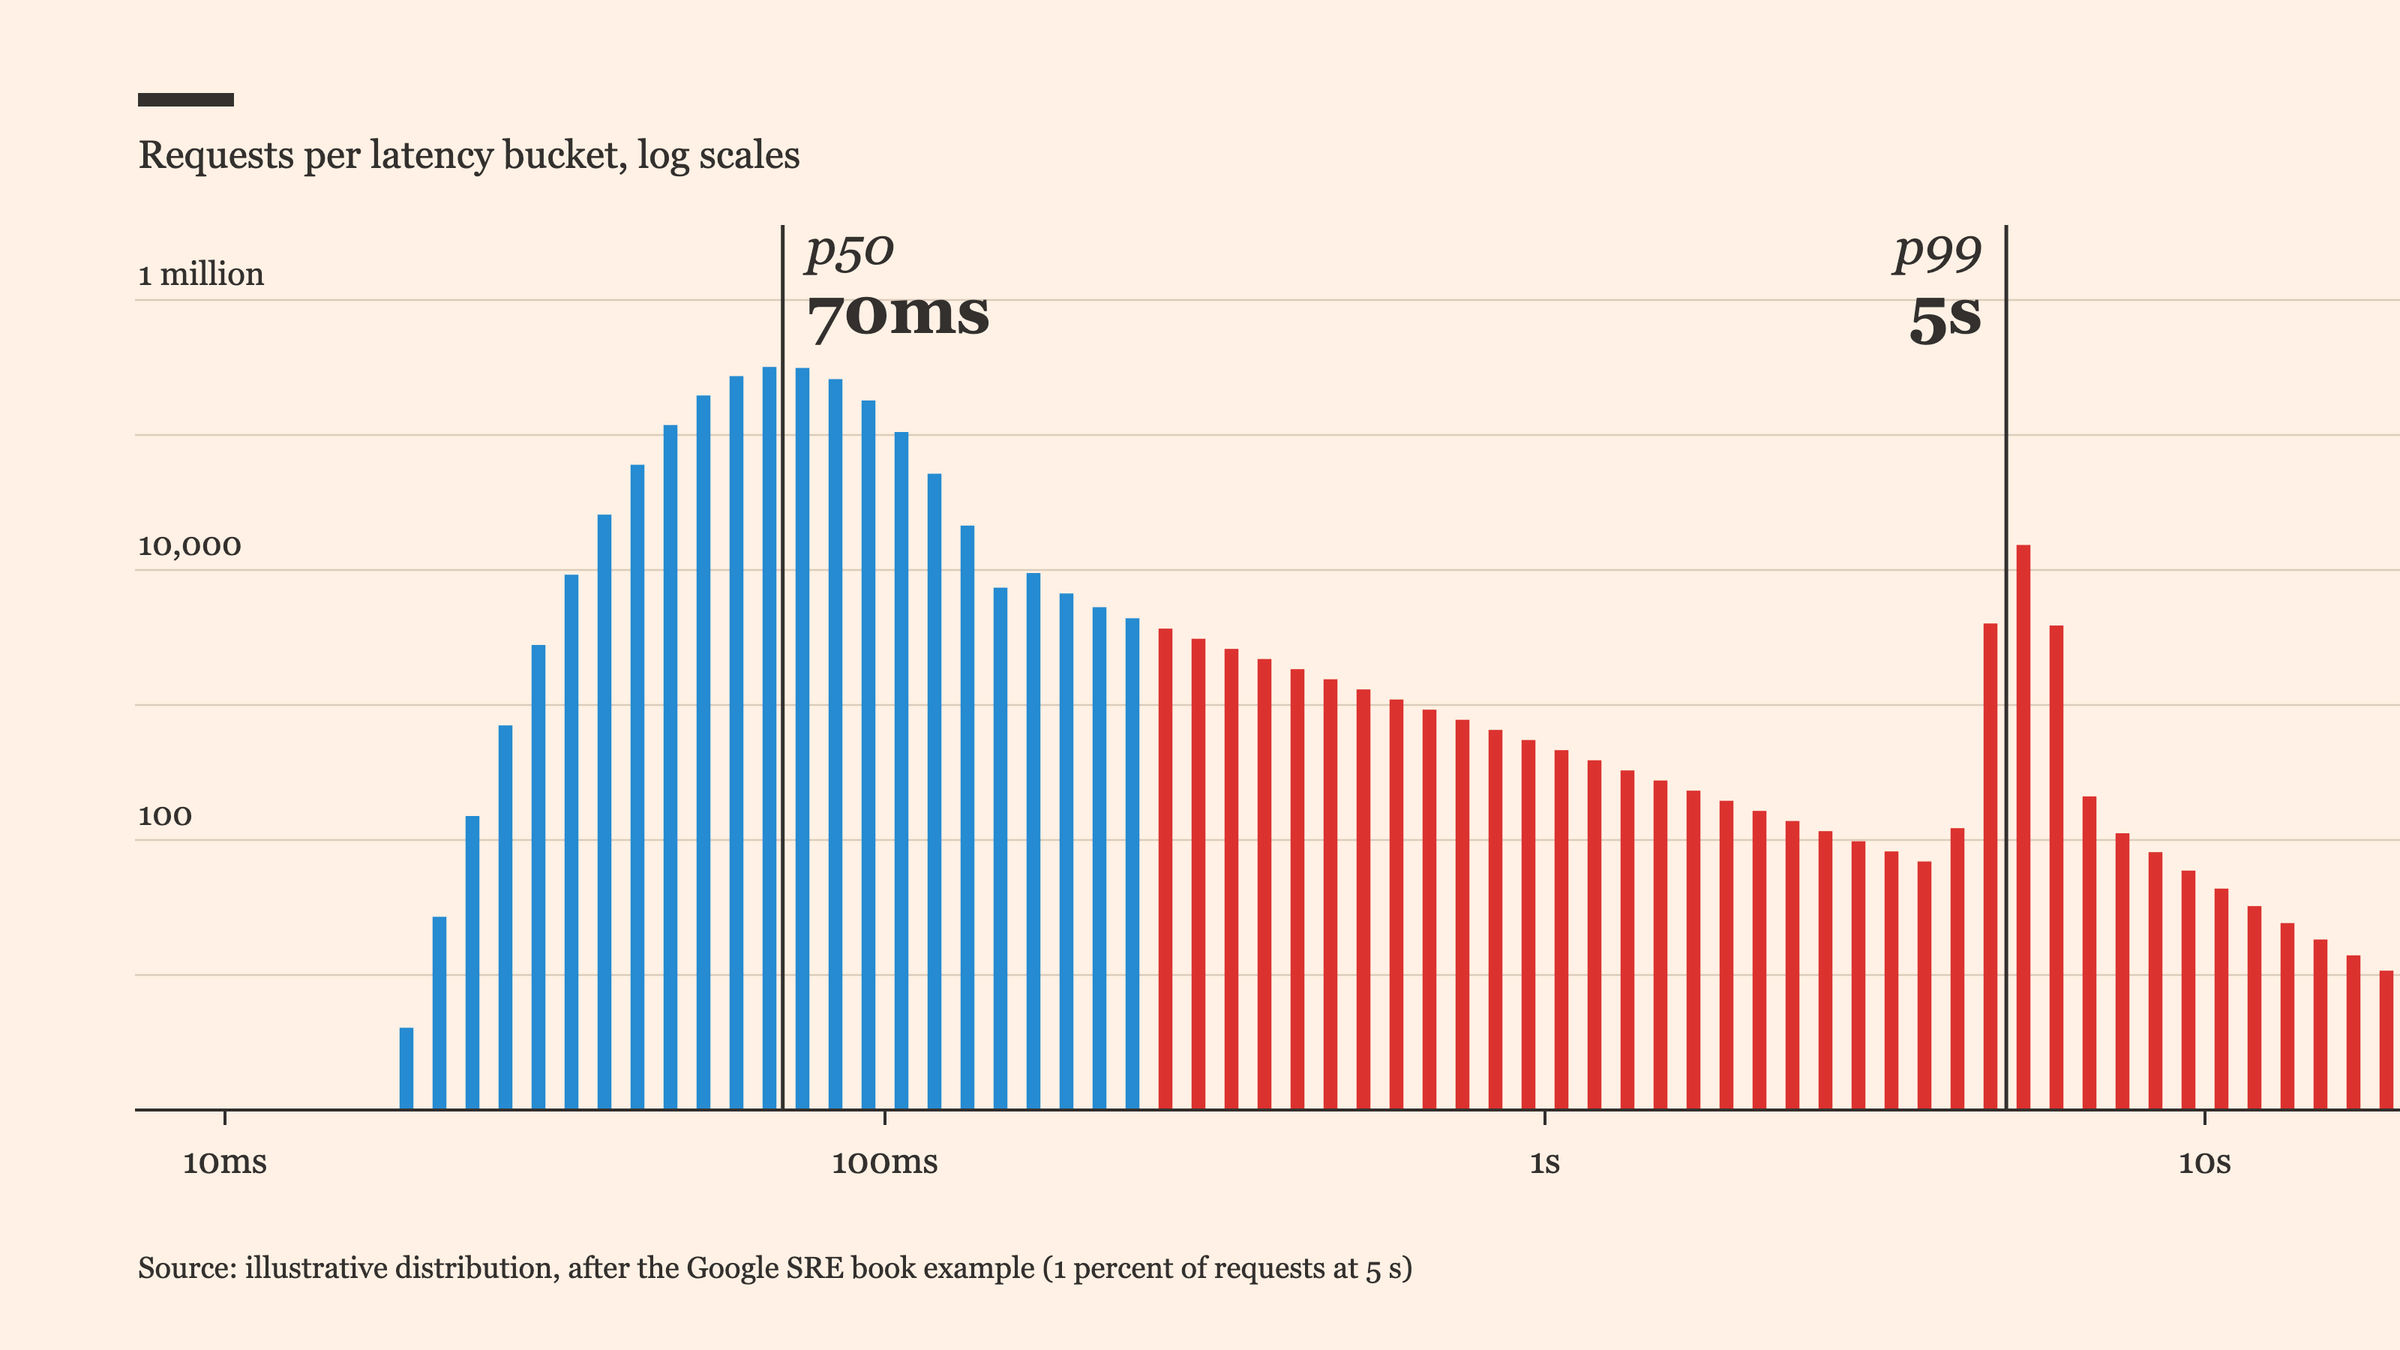
Metrics that measure latency distributions add their own multiplier, because each combination carries a full set of histogram buckets. Pair this work with sensible bucket choices; see p99 tail latency and why the average hides it. If a bad attribute inflated a bill rather than an alert, the investigation steps in finding the source of an unexpected cloud bill apply to observability spend as well.
Verify the fix worked
Verification is qualitative and should use the same queries that exposed the problem:
- The overflow series stops receiving new data, and the overflow alert clears after the window.
- The grouped sum matches the total again for the same period.
- Per-process series counts for the metric fall back under the limit and stop climbing across deploys and traffic changes.
- A replay test passes: send synthetic failing requests to the service and confirm the per-route error-ratio alert fires.
Under cumulative temporality, processes that already overflowed keep overflowing until they restart, so roll the fleet after deploying the fix before judging the result.
What to do Monday
- List your alerts and SLO queries that filter or group by a metric attribute. Those are the ones overflow can silence.
- For each metric behind them, list its attributes and the maximum distinct values of each. Multiply. Compare with the limit.
- Search for ids, URLs, and message strings in attribute sets. Remove or normalize them.
- Add the overflow alert and a dashboard panel for the overflow share.
- Add a total-based fallback alert for each critical breakdown alert.
- Write down a series budget per service so a new attribute needs a number attached to it in code review.
Sources
- Cardinality limits in OpenTelemetry, OpenTelemetry blog (2026): default of 2,000 combinations, overflow point and attribute, totals correct while breakdowns undercount, all attributes affected, sizing example, alerting advice.
- Metrics concepts, OpenTelemetry: cardinality definition, resource attributes remain queryable, temporality and recovery, views.
- Metrics SDK specification, OpenTelemetry: overflow aggregator, limit enforced after view filtering, cumulative and delta behavior, exemplars.
- Java SDK views, OpenTelemetry: attribute filter and cardinality limit view configuration, multiple matching views create separate streams.
- HTTP metrics semantic conventions, OpenTelemetry: route attribute must be a low-cardinality template.
- Metric and label naming, Prometheus: do not use labels for high-cardinality dimensions such as user ids.
- Sampling, OpenTelemetry: head versus tail sampling trade-offs.
Written by
Azeem Subhani
Senior Full-Stack & AI Application Engineer
I build SaaS, booking, payment, real-time, and AI-enabled web platforms with React, Next.js, Node.js, NestJS, Django, PostgreSQL, and AWS. My work includes Stripe payment systems, white-label booking flows, real-time collaboration, RAG workflows, and developer automation.