N+1 Query Detection in Postgres: pg_stat_statements, Not EXPLAIN
Find N+1 queries in Postgres when EXPLAIN says every query is fast and the request is slow. Sort pg_stat_statements by calls, then join or batch.
Azeem Subhani · · 11 min read
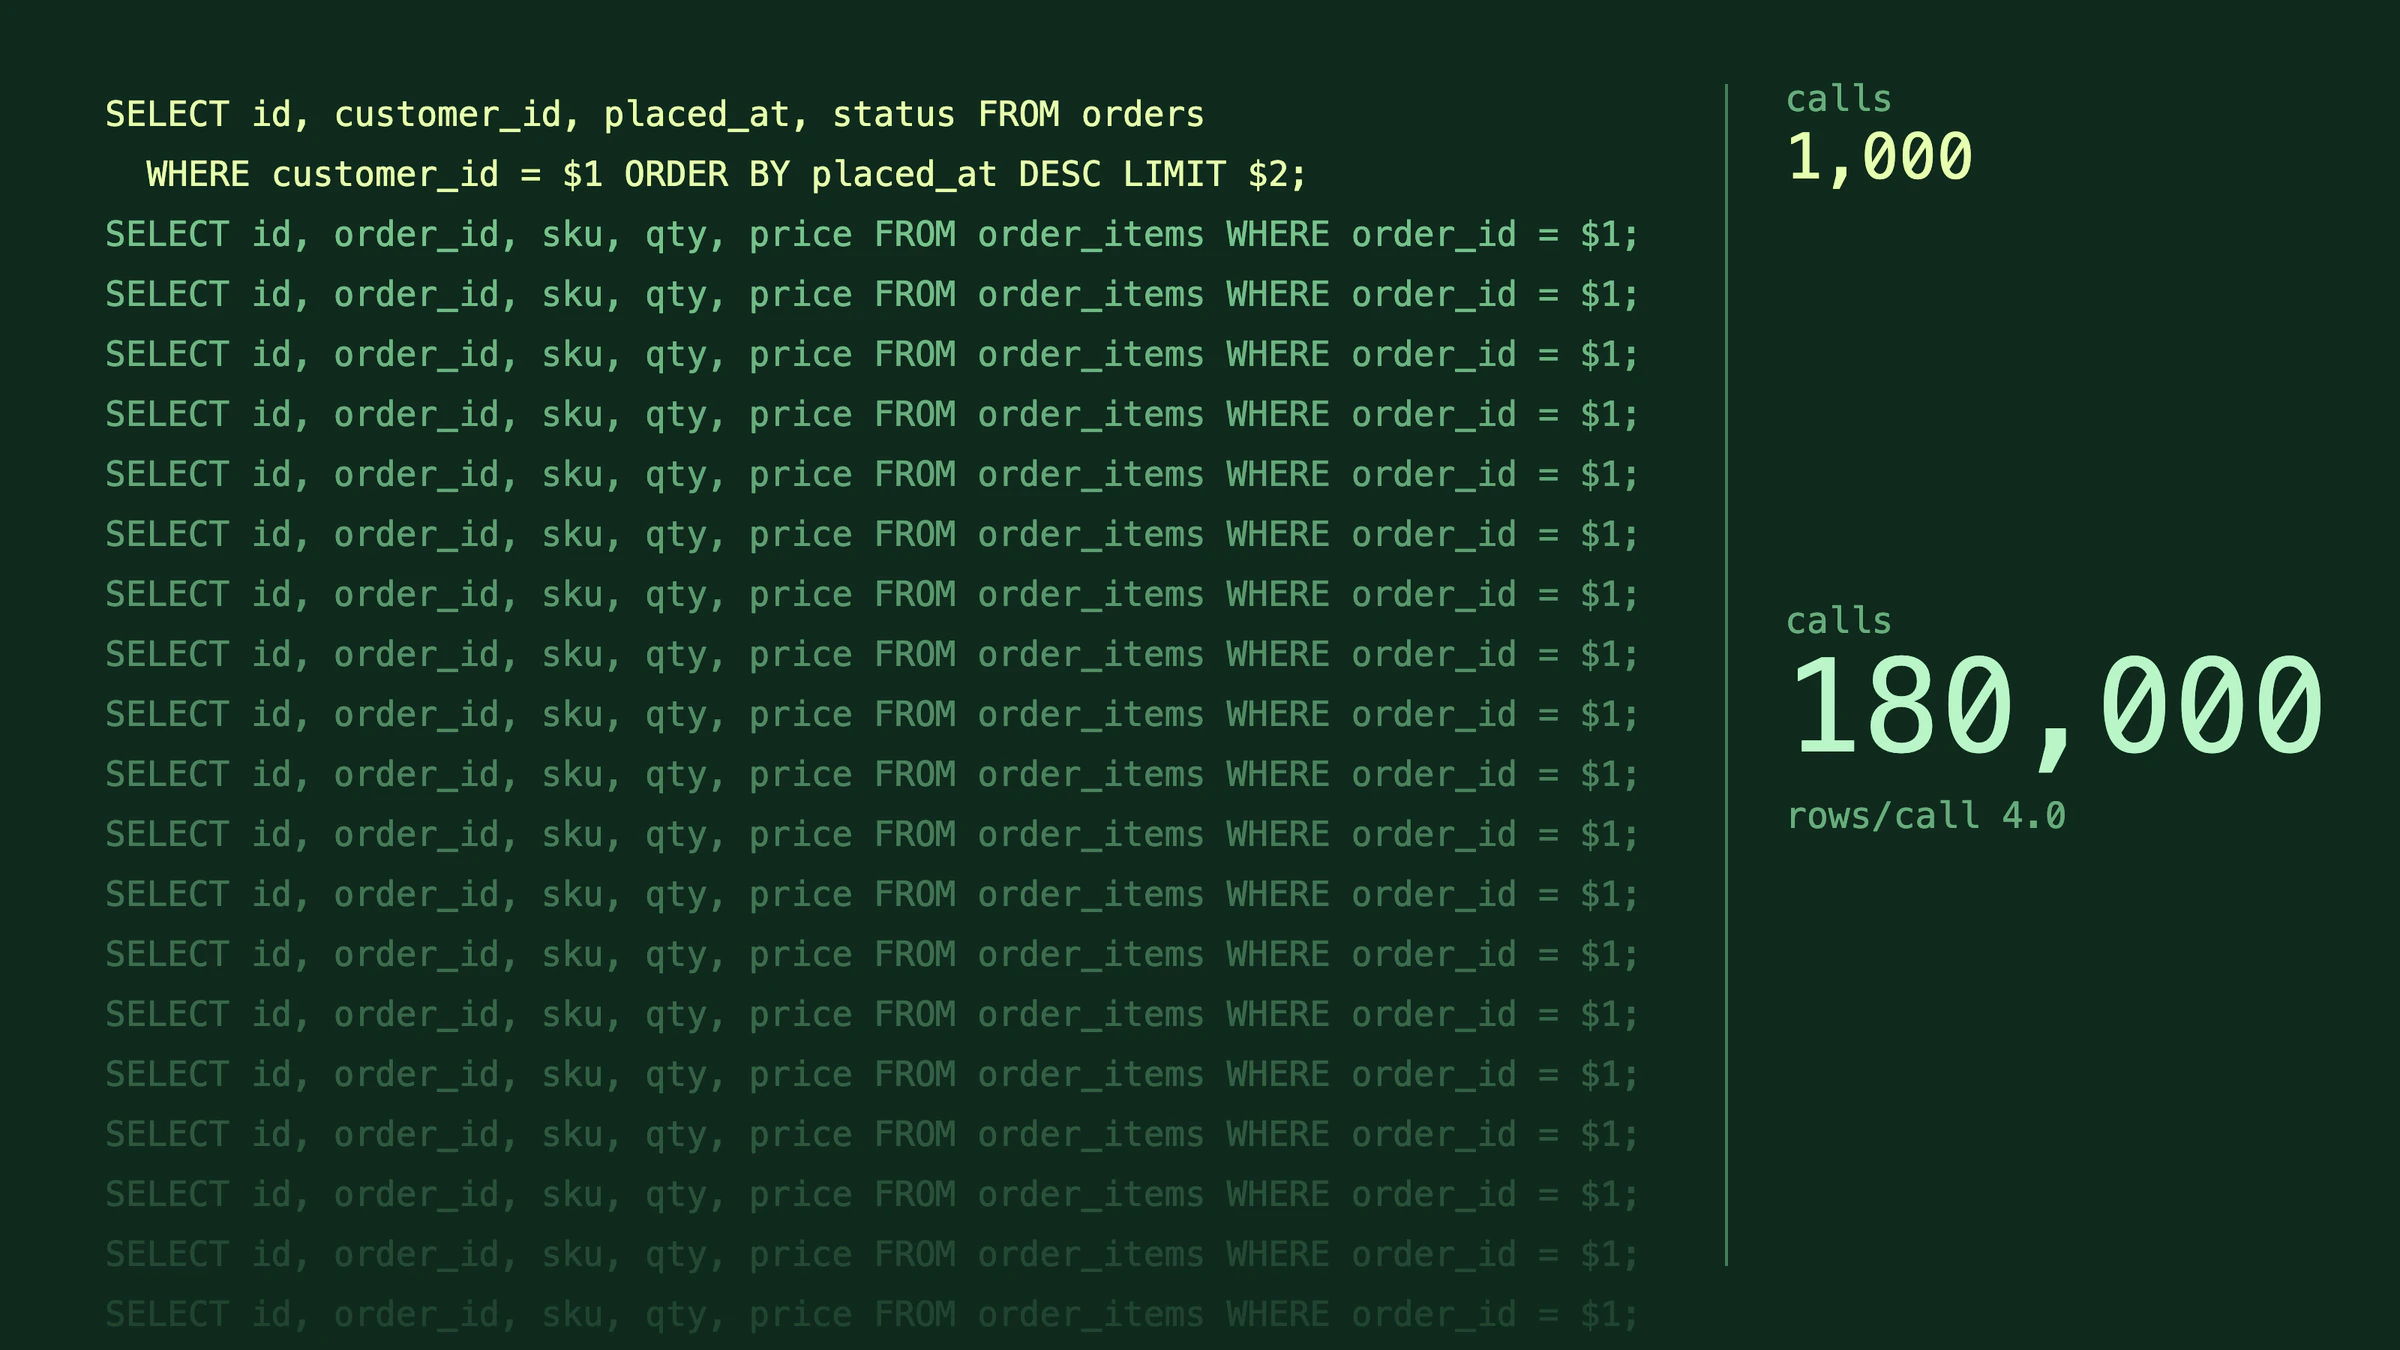
The orders page takes over a second. You pull the slowest-looking query from the request, run EXPLAIN ANALYZE, and get an index scan that finishes in a fraction of a millisecond. You run the parent query: also fast. A reasonable engineer concludes the database is fine and starts looking at the network or the template layer. The database is not fine. The request runs that fast child query once per order on the page, so the time lives in the count and the round trips, not in any single plan. That is an N+1 query, and the tool that finds it is not EXPLAIN but the aggregate view in pg_stat_statements, sorted the right way.
This post shows how to see the pattern in an application query log and in pg_stat_statements, why sorting by mean time hides it, how to choose between a join and a batched IN, and how to prove the fix worked.
What an N+1 query looks like in a log
An ORM loads a list of parent rows with one query. Then the template or serializer touches a relationship on each parent, and the ORM lazily loads it, one statement per parent. With 200 orders on a page, that is 1 query for the orders and 200 for their line items.
Turn on statement logging in a development environment (or use your ORM's query logger) and load the page once. The shape is unmistakable:
-- Illustrative application query log for one request
SELECT id, customer_id, placed_at, status FROM orders
  WHERE customer_id = 4821 ORDER BY placed_at DESC LIMIT 200;
SELECT id, order_id, sku, qty, price FROM order_items WHERE order_id = 99120;
SELECT id, order_id, sku, qty, price FROM order_items WHERE order_id = 99117;
SELECT id, order_id, sku, qty, price FROM order_items WHERE order_id = 99102;
... 197 more, identical except for the literal
Each child statement is cheap on the server. The cost is that the application waits for a full network round trip, driver work, and server-side parse and plan work 200 times in sequence. Nothing in a single plan shows that.
SQLAlchemy's documentation names the mechanism directly: lazy loading is the default, and for N loaded objects, accessing their lazy-loaded attributes means N+1 SELECT statements (SQLAlchemy relationship loading). Django's prefetch_related documentation uses the same example with pizzas and toppings (Django QuerySet API). GraphQL resolvers produce the same shape whenever a field resolver loads its own row.
Why EXPLAIN points the wrong way
EXPLAIN answers one question: how expensive is this statement, once, with these parameters? For an N+1 child query the honest answer is "very cheap," and that answer is correct. The bug is not in the plan. It is in the number of times the application asks.
That is why the most common first move goes wrong. An engineer sees a lookup on order_items.order_id, adds or tunes an index, re-runs EXPLAIN, and sees a slightly better plan for a statement that was already fast. The page stays slow, because 200 round trips at a slightly lower per-call cost are still 200 round trips.
There is a second trap. For a tiny statement, planning can cost as much as or more than execution. The N+1 detection write-up on database-execution-plan.com shows a child lookup whose planning time exceeds its execution time. Repeat that statement hundreds of times and the planner, not the executor, is a large share of the database work.
Whether a repeated statement is re-planned depends on how the driver sends it. PostgreSQL's PREPARE documentation says prepared statements save repeated parse analysis, and that with plan_cache_mode at its default of auto, the first five executions use custom plans before the server considers switching to a generic plan (PREPARE). Drivers, ORMs, and connection poolers differ in whether they keep prepared statements across a session, so check yours rather than assuming the planning cost is amortized.
Finding N+1 queries in statement statistics
pg_stat_statements aggregates every execution of a normalized statement into one row. Literal constants are replaced by parameter symbols such as $1, so the 200 child lookups above collapse into a single entry with a high calls count (pg_stat_statements). That collapse is exactly what makes the pattern visible.
The module must be loaded through shared_preload_libraries, which needs a server restart, and it needs query identifiers enabled. Managed providers usually expose it as an extension you enable through their parameter settings.
The mean-time trap
Most dashboards and copy-pasted queries sort by mean_exec_time. That surfaces statements that are slow per call, which is useful for finding a bad plan and useless for finding an N+1 query. The child lookup is among the fastest statements on the server per call, so it sinks to the bottom of that list. Sort by calls and by total_exec_time instead:
-- Illustrative: top statements by total execution time, with call counts.
-- Run on a replica or during a quiet window if the view is very large.
SELECT
  queryid,
  calls,
  round(total_exec_time::numeric, 1)          AS total_ms,
  round(mean_exec_time::numeric, 3)           AS mean_ms,
  rows,
  round((rows::numeric / NULLIF(calls, 0)), 1) AS rows_per_call,
  left(query, 120)                            AS query
FROM pg_stat_statements
ORDER BY total_exec_time DESC
LIMIT 25;
The signature of an N+1 child is a statement near the top of this list with a very low mean_ms, a calls count far higher than the endpoint's request count, and a small rows_per_call (often around one, or a handful for a one-to-many). The parent statement usually sits nearby with a call count close to the request count.
Estimating the fan-out
Divide child calls by parent calls over the same window. If the parent ran 1,000 times and the child ran 180,000 times, each request averages 180 child lookups. To get a clean window, record a snapshot, exercise the endpoint, and diff. pg_stat_statements_reset() clears the counters entirely, which is convenient on a dedicated environment and disruptive on a shared one where other people rely on the history (pg_stat_statements).
What the database view leaves out
Two blind spots matter here.
total_exec_timeexcludes planning. Planning statistics (plans,total_plan_time,mean_plan_time) are only collected whenpg_stat_statements.track_planningis on, and it is off by default. The documentation warns it may incur a noticeable penalty when many connections run statements with identical structure, which is precisely the N+1 workload. Enable it deliberately for an investigation, not as a permanent default.- The database never sees network latency, driver overhead, or the time the application spends materializing objects. The real cost per request is larger than any number in pg_stat_statements.
So use pg_stat_statements to find the pattern and the fan-out, and use application-side query counts and request timing to measure the cost.
Diagnosis procedure
- Pick the slow endpoint and count queries per request with your ORM's logger, an APM span count, or the test helper shown later.
- If the count scales with the number of rows on the page, you have N+1. Confirm by loading a page with 10 rows and one with 100.
- In pg_stat_statements, sort by
total_exec_timeand bycalls. Find the child statement with high calls, low mean, low rows per call. - Compute the fan-out ratio against the parent statement.
- Only after the count is fixed, look at the remaining statements' plans.
Join or batched IN for a one-to-many
There are two structural fixes. Both replace N statements with a constant number. They differ in what they cost when the relationship is one-to-many.
Join
A join returns parents and children in one result set:
-- One round trip. Each order row repeats once per line item.
SELECT o.id, o.placed_at, o.status, i.sku, i.qty, i.price
FROM orders o
LEFT JOIN order_items i ON i.order_id = o.id
WHERE o.customer_id = $1
ORDER BY o.placed_at DESC, o.id, i.id;
For a many-to-one (each item has one product, each order has one customer), a join is the natural fix and adds no duplication. For a one-to-many, every parent column is repeated once per child. An order with 40 line items arrives as 40 rows carrying the same order columns. The application has to de-duplicate, and SQLAlchemy says so explicitly: a joinedload on a collection requires Result.unique() because rows are "multiplied out by the join" (SQLAlchemy relationship loading). Join two collections at once and the multiplication compounds.
There is also a paging bug hiding here. LIMIT 20 on the joined query limits joined rows, not orders, so a page can end in the middle of an order's items.
Batched IN
A batched load runs the parent query, collects the parent keys, and loads all children in one more statement:
-- Second round trip. One row per child, no parent duplication.
SELECT id, order_id, sku, qty, price
FROM order_items
WHERE order_id = ANY($1::bigint[])
ORDER BY order_id, id;
The application groups children by order_id in memory. That is two round trips regardless of how many parents are on the page, and the result size equals the real number of children. SQLAlchemy's selectinload does this, and its documentation notes it emits the IN for up to 500 parent keys at a time, so very large parent sets become a few batches rather than one giant statement (SQLAlchemy relationship loading). Django's prefetch_related does the same with a separate lookup per relationship and joins in Python (Django QuerySet API).
Binding an array to = ANY($1) keeps the statement text identical no matter how many keys you pass. A literal IN (...) list can produce a different statement text per list length. PostgreSQL 18's pg_stat_statements documentation shows IN lists of different lengths merging into one entry, rendered as IN ($1 /*, ... */). The PostgreSQL 17 documentation does not describe that merging, so on older versions expect a batched IN to appear as several entries if list lengths vary.
How to choose
- Many-to-one or one-to-one: join (Django
select_related, SQLAlchemyjoinedload). - One-to-many or many-to-many: batched load (
prefetch_related,selectinload), unless the child count per parent is small and bounded and you need a single round trip. - Nested collections: one batched load per level. Three levels is three or four statements, not a three-way join that multiplies rows at every level.
Fixes beyond eager loading
Select only what the screen uses
N+1 fixes often load whole rows when the page shows three columns. Narrow the select list (only() in Django, explicit columns in SQL). Smaller rows mean less transfer and less object construction, and they make an index-only scan possible when an index covers the columns.
Request-scoped batching for resolvers
In GraphQL, or any code where each field resolves independently, use a request-scoped batcher. DataLoader collects all loads issued in a single tick of the event loop and calls your batch function once with every key; the batch function must return values in the same order and length as the keys (graphql/dataloader).
// Illustrative: one DataLoader per request, never shared across users.
import DataLoader from "dataloader";
import type { Pool } from "pg";

// order_id is bigint; drivers may return int8 as a string, so normalize keys.
type OrderItem = { id: string | number; order_id: string | number; sku: string; qty: number };

export function makeLoaders(db: Pool) {
  return {
    itemsByOrder: new DataLoader<number, OrderItem[]>(async (orderIds) => {
      const { rows } = await db.query<OrderItem>(
        "SELECT id, order_id, sku, qty FROM order_items WHERE order_id = ANY($1::bigint[]) ORDER BY id",
        [orderIds as number[]],
      );
      const byOrder = new Map<number, OrderItem[]>();
      for (const row of rows) {
        const key = Number(row.order_id); // same key type as the loader's input
        const list = byOrder.get(key) ?? [];
        list.push(row);
        byOrder.set(key, list);
      }
      // Same length and order as the input keys; empty array when none.
      return orderIds.map((id) => byOrder.get(id) ?? []);
    }),
  };
}
The DataLoader README recommends a new instance per web request, because its memoization cache would otherwise leak data across users with different permissions. Batching only helps if the loads happen before the response is sent; work deferred to after the response, or awaited one at a time in a loop, falls back to one query per key.
Make lazy loads fail loudly
SQLAlchemy's raiseload replaces lazy loading with an error, so an accidental relationship access in a serializer fails in tests instead of quietly issuing queries (SQLAlchemy relationship loading). Apply it on hot endpoints where you have already chosen the loading strategy.
Assert the query count on hot endpoints
A fix that is not enforced regresses the next time someone adds a field to a serializer. Assert the count in a test. Django provides assertNumQueries, usable as a context manager (Django testing tools):
# Illustrative Django test: the count must not depend on page size.
from django.test import TestCase
from django.urls import reverse

from shop.tests.factories import make_orders  # your own fixture helper


class OrderListQueryCount(TestCase):
    def test_query_count_is_flat(self):
        customer = make_orders(count=5)
        # Pick the number your view actually issues: orders + items + any fixed overhead.
        with self.assertNumQueries(3):
            self.client.get(reverse("order-list", args=[customer.id]))

        make_orders(count=50, customer=customer)
        with self.assertNumQueries(3):
            self.client.get(reverse("order-list", args=[customer.id]))
The second assertion is the important one. A test that only checks one page size can pass with N+1 if the fixture happens to have one row. Test two sizes and require the same count.
Trade-offs and when not to use each fix
- Join on a one-to-many saves a round trip and multiplies parent rows. Memory and transfer grow with children per parent, and
LIMITstops meaning "N parents." Avoid it for unbounded collections. - Batched IN is a second round trip that stays flat as the parent count grows. It costs an in-memory grouping step and, for very large key sets, multiple batches. It is the safer default for collections.
- Request-scoped batching removes accidental queries across independent resolvers, and it only works if loads are issued together before the response is sent. It is extra machinery for a plain REST endpoint where a single
prefetch_relatedwould do. - Caching the children (in Redis or an in-process cache) makes the symptom disappear without removing the pattern. The query count returns on every cache miss, and the cache can serve relations that changed since they were stored. Use it for read-heavy reference data, not as an N+1 fix.
- Indexing the child lookup is correct if the lookup is not already indexed, and it is the wrong first move. It makes each of N calls slightly cheaper and leaves N unchanged. Fix the count first, then check whether the single batched statement needs an index on
order_id.
How to confirm the fix
A prettier plan for the child statement proves nothing. Confirm the count:
- The application query count for the endpoint is constant across page sizes (the test above).
- In pg_stat_statements, over a comparable traffic window,
callsfor the child statement drops from a multiple of the request count to roughly the request count, and a new batched statement appears with a higherrows_per_call. - Request latency for the endpoint drops in your APM, and the number of database spans per request drops with it.
- Total database time for the endpoint falls even if the new batched statement has a higher mean time than the old child lookup. That higher mean is expected: one statement now does the work of many.
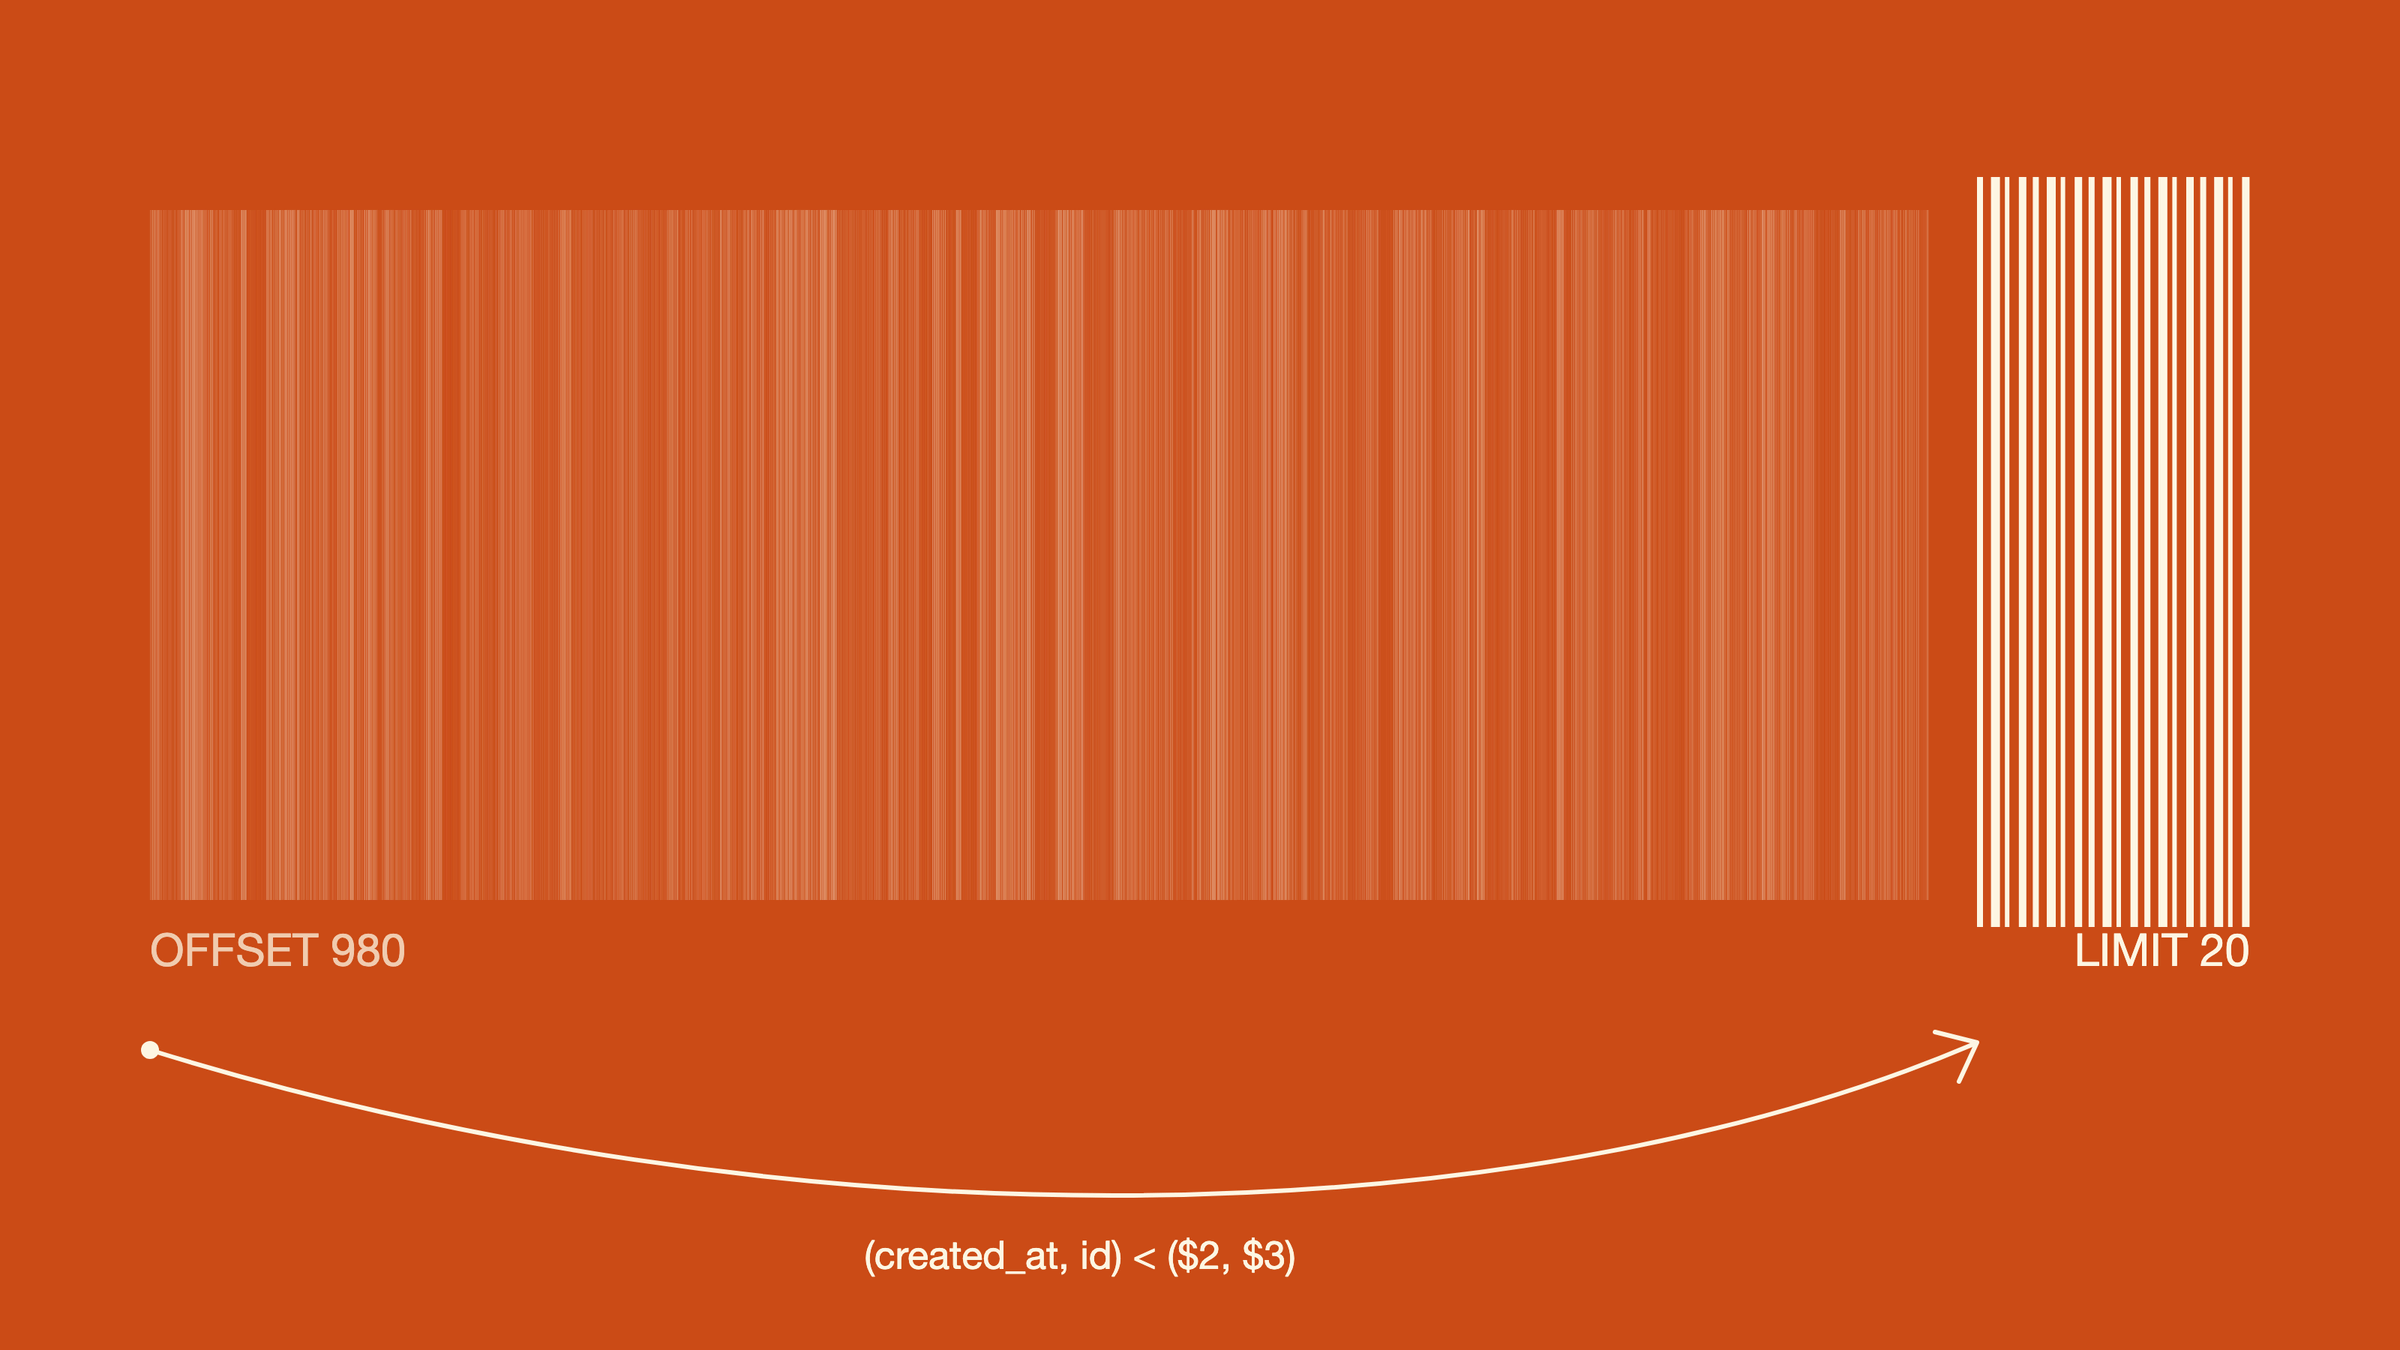
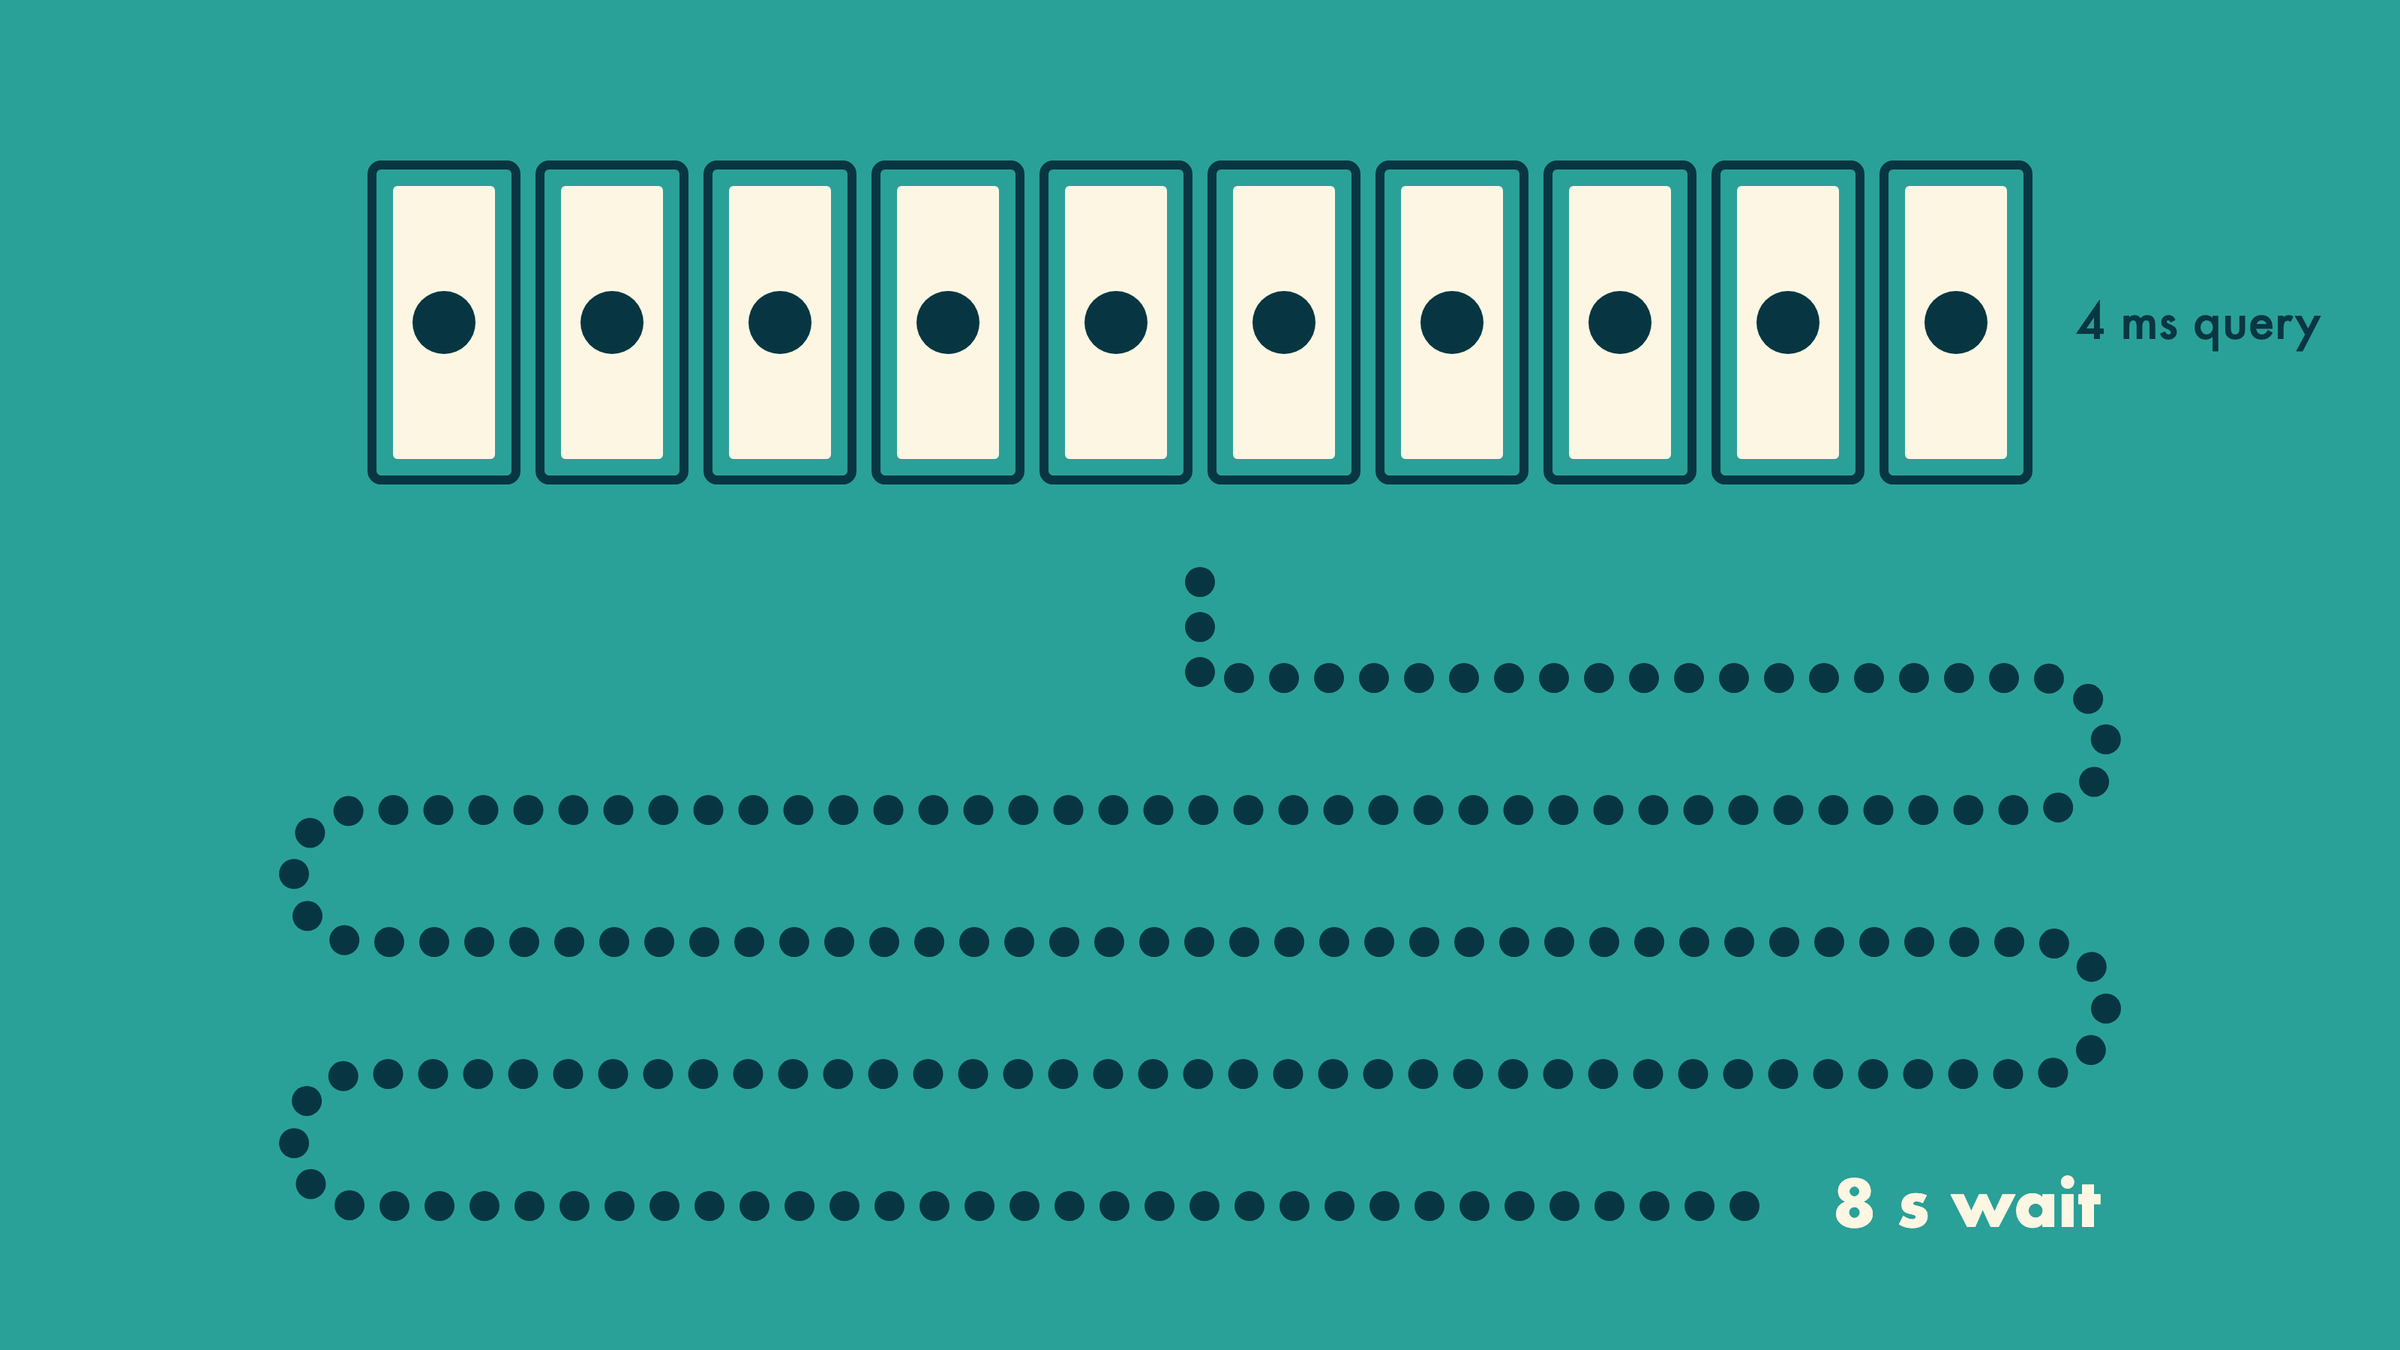
For more on how per-request database work interacts with pool limits, see API slow under load: connection pool waits. If the page that fans out is also deep-paginated, offset versus keyset pagination covers the second half of the problem, and p99 tail latency explains why fan-out hurts the tail more than the median.
Checklist for Monday
- Sort pg_stat_statements by
total_exec_timeandcalls, notmean_exec_time. - Flag statements with high calls, low mean, and about one row per call.
- Compute the child-to-parent call ratio for the suspect endpoint.
- Join many-to-one relations; batch one-to-many relations with
= ANY($1). - Select only the columns the response uses.
- Add a query-count test at two page sizes on each hot endpoint.
- Turn on
track_planningonly for the investigation window.
Sources
- PostgreSQL 18: pg_stat_statements: columns, normalization, IN list merging,
track_planningdefault and overhead, reset function. - PostgreSQL 17: pg_stat_statements: normalization behavior before IN list merging was documented.
- PostgreSQL: PREPARE: custom versus generic plans and
plan_cache_mode. - N+1 query detection with execution plans: planning time exceeding execution time for tiny repeated statements; sorting by calls and total time.
- SQLAlchemy 2.0: relationship loading techniques: lazy loading and N+1,
selectinloadbatching,joinedloadrow multiplication,raiseload. - Django 5.2: QuerySet API:
select_related,prefetch_related,only. - Django 5.2: testing tools:
assertNumQueries. - graphql/dataloader: per-tick batching, batch function contract, per-request instances.
Written by
Azeem Subhani
Senior Full-Stack & AI Application Engineer
I build SaaS, booking, payment, real-time, and AI-enabled web platforms with React, Next.js, Node.js, NestJS, Django, PostgreSQL, and AWS. My work includes Stripe payment systems, white-label booking flows, real-time collaboration, RAG workflows, and developer automation.