API Slow Under Load? Measure Connection Pool Wait Before Tuning
Pool wait, not query time, is often why APIs slow down under load. Measure wait and hold time, cap waiters, and size the pool for the database.
Azeem Subhani · · 10 min read
The endpoint answers in a few milliseconds on your laptop and in staging. Then real traffic arrives, p99 climbs into seconds, and the gateway starts returning timeouts. You open the database dashboard expecting a fire and find CPU sitting comfortably low, no slow queries, and replication healthy. When an API is slow under load like this, the usual cause is not a slow query. It is a connection pool (or a lock, or a worker pool) that requests must wait for before they are allowed to run a fast query at all.
The careful-engineer mistakes come in a predictable order: tune the query that the APM trace highlights, raise the pool size, then add instances. Each of those can be the right move, and each can make things worse when the actual problem is time spent waiting for a scarce resource. This post gives you a measurement boundary to draw first, a diagnosis order that crosses off the wrong conclusions, and fixes ranked by how directly they shorten the wait.
Why an API gets slow under load while the database is idle
A connection pool is a queue in front of a fixed number of servers. Each request that needs the database borrows a connection, holds it for some time, and returns it. The number of requests the pool can serve per second is bounded by two numbers: how many connections it has, and how long each request holds one.
The arithmetic is the same one AWS documents for Lambda concurrency: concurrency equals average requests per second multiplied by average duration in seconds (AWS Lambda docs). Apply it to the pool and rearrange: a pool of N connections, each held for H seconds per request, can sustain at most N divided by H requests per second. Above that rate, requests pile up in the pool's wait queue, and the wait grows for as long as arrivals exceed the ceiling.
Two things follow that surprise people:
- Hold time matters as much as query time. A request that runs two 3 ms queries but keeps the connection checked out for 400 ms while it does other work consumes 400 ms of pool capacity, not 6 ms. The database sees two fast queries and an idle session in between, so its CPU stays low.
- Every endpoint that shares the pool shares the queue. The slow handler does not just slow itself. Fast endpoints, background jobs, and health checks that touch the database all queue behind it. When the health check times out, the orchestrator may restart healthy instances, which converts a latency problem into an outage.
One public write-up describes exactly this shape: database CPU around 15 percent, an empty slow query log, and API p95 going from 180 ms to over 9 seconds, caused by a feature that held a connection across an external HTTP call in a pool of 20 (Krishnam Murarka on dev.to). Treat those numbers as one team's incident, not as typical. The mechanism is what generalizes.
Separate wait time from use time
Before you change a query, a pool size, or an instance count, split the time a request spends on the database into two series:
- Wait time: from asking the pool for a connection to receiving one (or timing out).
- Use time: from receiving the connection to returning it.
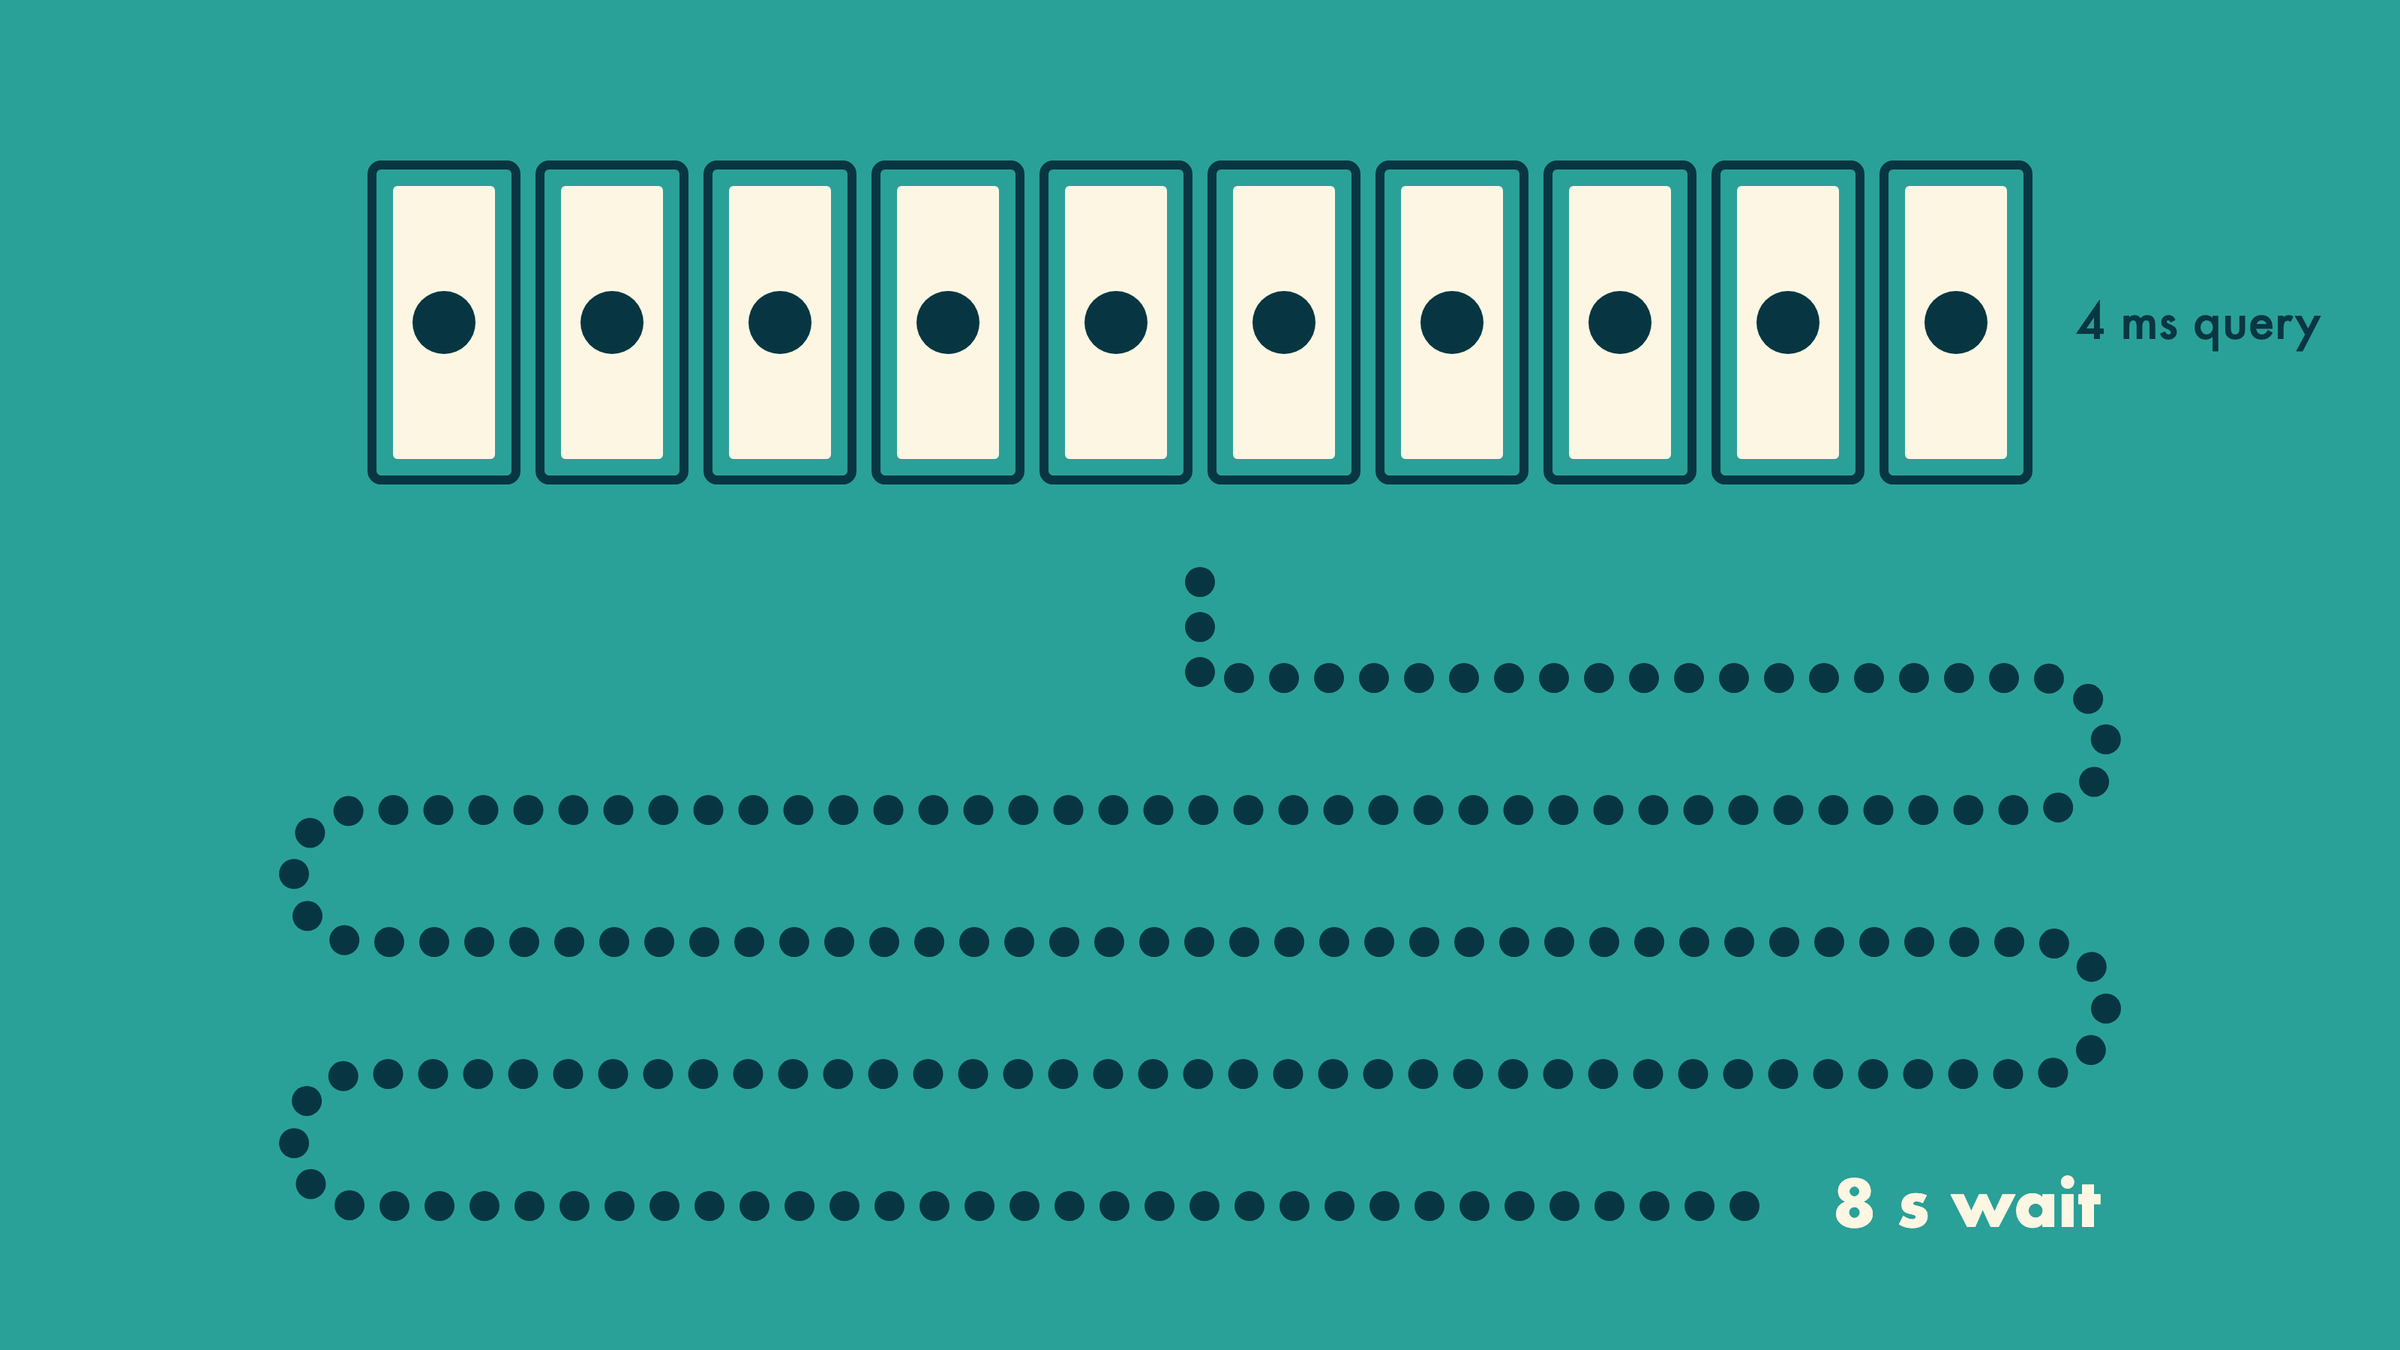
Query execution time is a third, smaller number that sits inside use time. Most APM tools show you query time by default, which is why teams spend days optimizing a 4 ms query while requests wait 8 seconds to run it.
Most pools already expose these numbers if you ask:
- HikariCP publishes
pool.Wait(a timer for how longgetConnection()callers wait),pool.Usage(a histogram of how long connections stay out of the pool), andpool.PendingConnections(threads waiting for a connection) through its Dropwizard metrics integration (HikariCP wiki). - node-postgres exposes
totalCount,idleCount, andwaitingCounton the pool (node-postgres Pool docs). It does not time acquisition for you, so you wrap it. - OpenTelemetry defines
db.client.connection.wait_time,db.client.connection.use_time, anddb.client.connection.pending_requestsin its database semantic conventions. As of October 2026 these connection-pool metrics are marked Development, so names can still change (OpenTelemetry semantic conventions).
If your pool does not report wait and use time, measure them yourself. The wrapper below is illustrative TypeScript for node-postgres. It records both durations and caps how long a caller may wait.
// Illustrative: measure pool wait vs. hold time with node-postgres.
import { Pool, PoolClient } from "pg";
import { metrics } from "@opentelemetry/api";

const meter = metrics.getMeter("db-pool");
const waitHist = meter.createHistogram("app.db.pool.wait", { unit: "ms" });
const holdHist = meter.createHistogram("app.db.pool.hold", { unit: "ms" });

export const pool = new Pool({
  connectionString: process.env.DATABASE_URL,
  max: 10,
  // Default is 0, which means "wait forever". Cap it so callers fail fast.
  connectionTimeoutMillis: 2_000,
});

export async function withConnection<T>(
  route: string,
  fn: (client: PoolClient) => Promise<T>,
): Promise<T> {
  const askedAt = performance.now();
  let client: PoolClient;
  try {
    client = await pool.connect();
  } catch (err) {
    waitHist.record(performance.now() - askedAt, { route, outcome: "timeout" });
    // Surface as 503 upstream; do not retry inside the request.
    throw new PoolExhaustedError(route, { cause: err });
  }
  const gotAt = performance.now();
  waitHist.record(gotAt - askedAt, { route, outcome: "acquired" });

  try {
    return await fn(client);
  } finally {
    holdHist.record(performance.now() - gotAt, { route });
    client.release();
  }
}

export class PoolExhaustedError extends Error {
  constructor(public route: string, options?: { cause?: unknown }) {
    super(`db pool wait exceeded for ${route}`, options);
  }
}
Tag the hold histogram by route. The route with a hold time far above its query time is the one starving everyone else. Keep the label set small (route template, not raw URL) so the metric does not explode; see the metric cardinality post for why.
A diagnosis order that rules out the wrong fixes
Work through these in order. Each step either finds the limit or crosses off a tempting wrong conclusion.
- Confirm the arrival rate. Compare request rate at the time of the slowdown against a normal period. If traffic did not change much, a new deploy or a slower dependency changed hold time. If traffic jumped, you may simply have crossed the N divided by H ceiling.
- Name the concurrency limit. List every bounded resource on the request path: the DB pool, HTTP client connection pools, worker threads, a semaphore, row locks. Note the size of each.
- Measure time waiting for that limit. If pool wait p99 is a large fraction of request latency, you have found the queue. If wait is near zero, the pool is not your problem; move on to the next resource.
- Measure time using it. Compare hold time per route with query time per route. A large gap means the connection is held while the code does something else: an HTTP call, a file upload, serialization, or awaiting another pool.
- Measure time in other services. Only after steps 3 and 4 should you chase downstream latency. A slow downstream that runs outside any held resource costs that request; one that runs inside a held connection costs every request.
On the database side, ask Postgres what the sessions are doing. This query groups client sessions by state and shows the oldest open transaction:
-- Illustrative: what are the app's sessions doing right now?
SELECT state,
       count(*)                    AS sessions,
       max(now() - xact_start)     AS oldest_open_xact,
       max(now() - state_change)   AS longest_in_state
FROM pg_stat_activity
WHERE backend_type = 'client backend'
  AND datname = current_database()
GROUP BY state
ORDER BY sessions DESC;
Postgres documents idle in transaction as a backend that is inside a transaction but not executing a query (PostgreSQL monitoring docs). Many sessions in that state, with low CPU, is the signature of connections held across application work. Many sessions active with a non-null wait_event_type points to lock waits or I/O inside the database, which is a different problem.
Why adding instances can make an API slower
Horizontal scaling feels safe because it usually is. With a database behind a per-instance pool, it changes the math: total connections equal instances multiplied by pool size. Doubling instances doubles the connections the database must serve.
That matters for two reasons. First, Postgres has a hard ceiling. max_connections defaults to 100, can only be changed at server start, and a few slots are reserved for superusers by default (PostgreSQL connection settings). New instances can fail to connect at all. Second, even below the ceiling, a database with more active sessions than it can usefully run in parallel spends time on contention and context switching. The HikariCP pool-sizing note cites an Oracle demonstration where cutting the pool from 2048 connections to 96 dropped response times from about 100 ms to about 2 ms (HikariCP, About Pool Sizing). Your numbers will differ. The direction is the lesson: past the database's useful concurrency, more connections move the queue into the database, where it is harder to see and more expensive.
If the instances are serverless functions, the multiplication is worse because instance count is not under your direct control. The serverless connection limits post covers that arithmetic and the poolers that fix it.
Fixes that shorten the wait
Rank fixes by how directly they reduce hold time or protect the queue. Pool size comes last.
Shorten connection hold time
Acquire the connection as late as possible and release it as early as possible. Do request parsing, validation, authorization against cached data, and response serialization outside the borrowed connection. If an ORM opens a connection per request by default (for example, through middleware that wraps every handler in a transaction), make that opt-in for the routes that need it.
Move remote calls out of the transaction
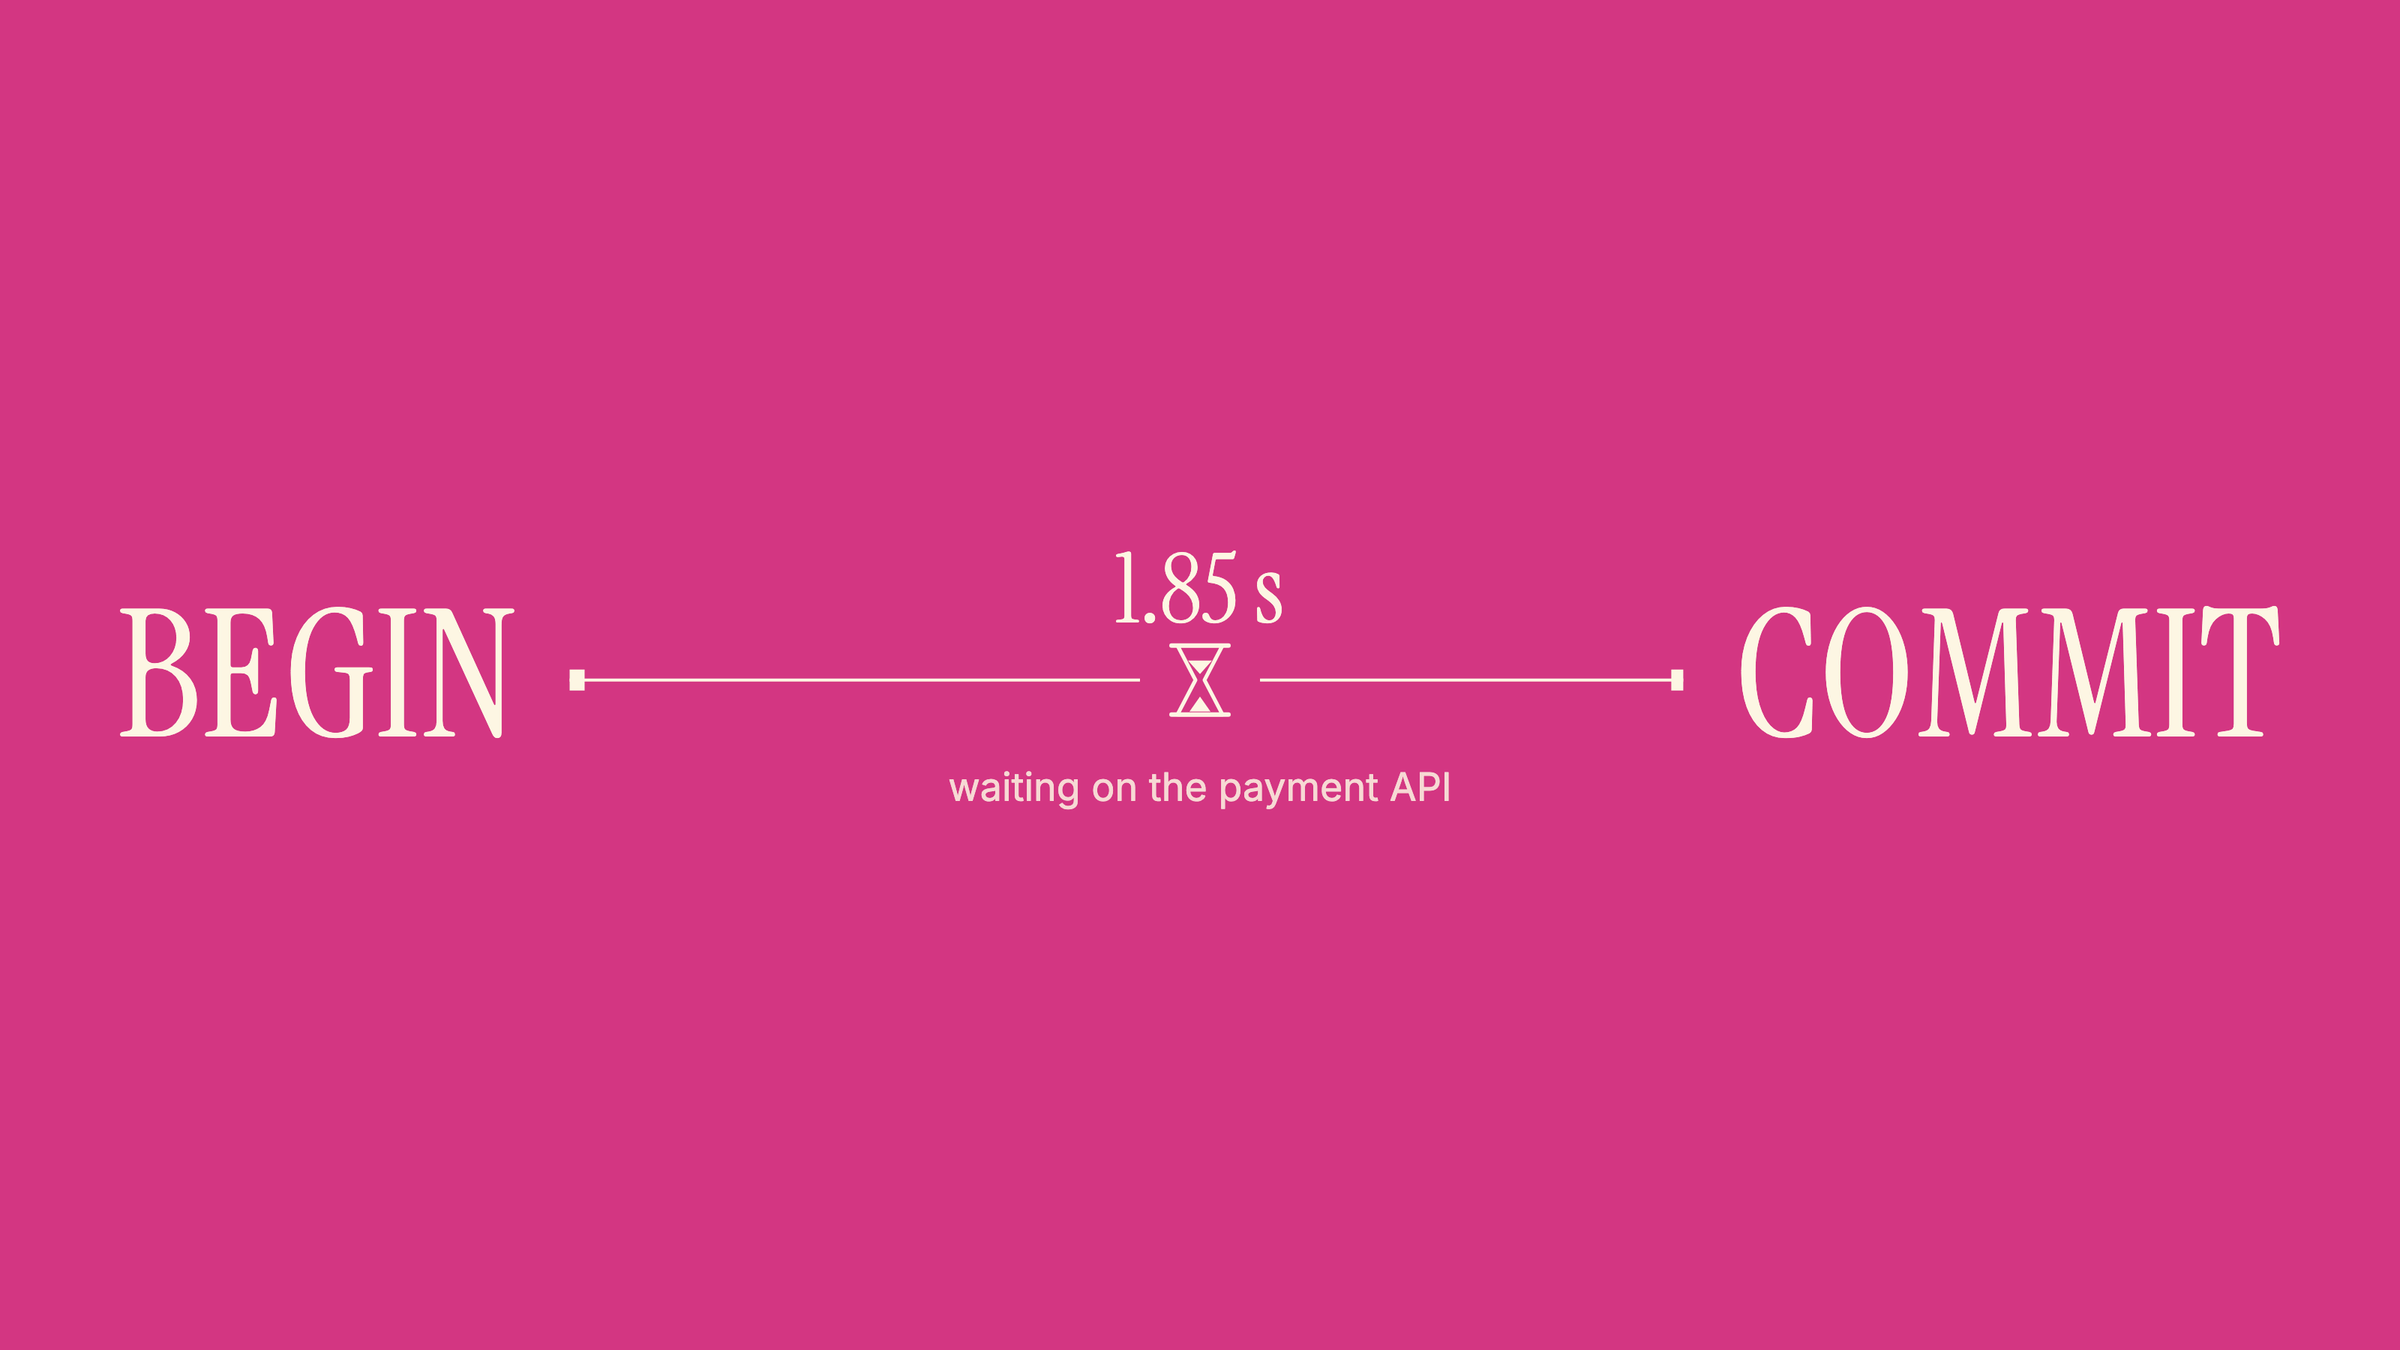
The single highest-leverage fix is removing network calls from inside a held connection. A handler that reads a row, calls a payment or email provider, then writes a row inside one transaction holds the connection for the full round trip. Restructuring that handler safely needs an idempotency key and a way to complete or undo half-finished work; the long transactions post walks through the pattern.
Cap waiters and fail fast
An unbounded wait queue converts overload into latency for everyone. node-postgres defaults connectionTimeoutMillis to 0, which means no timeout (node-postgres Pool docs). HikariCP defaults connectionTimeout to 30 seconds (HikariCP README), which is often longer than your gateway timeout, so callers are abandoned while still queued and the work they eventually do is wasted.
Set acquisition timeouts below the upstream timeout and return 503 with a Retry-After header when they fire. Make sure clients back off instead of retrying immediately, or the fast failures become a retry storm.
Size the pool for the database, then load-test
HikariCP's widely quoted starting point is connections equal to core count times two plus effective spindle count, so a 4-core server with one disk lands near 9 or 10 (HikariCP, About Pool Sizing). The same page says to treat that as a baseline and test around it under expected load. It describes the database server's useful parallelism, not a per-instance number, so divide it across every instance and every service that shares the database.
The page also gives a separate rule for avoiding pool deadlock when a single thread needs several connections at once: pool size of at least Tn times (Cm minus 1) plus 1, where Tn is the maximum thread count and Cm is the most connections a single thread holds at once. If you find code that needs two connections at once, treat it as a hold-time smell before you resize.
Cache repeated reads
Requests that never borrow a connection never wait for one. Caching hot, read-mostly data removes load from the pool entirely. It also introduces staleness, so decide per endpoint how stale is acceptable.
Trade-offs and when not to use each fix
- A smaller pool protects the database and increases application wait. Shrink it only after hold time is under control; otherwise you trade database contention for a longer application queue.
- A larger pool helps only when the database has unused capacity and wait dominates. If database CPU or I/O is already near its limit, a larger pool moves the queue into the database and makes every query slower.
- Failing fast returns errors sooner and keeps the queue short. It does not create capacity. Without client backoff and without a hold-time fix, you have replaced timeouts with 503s.
- Caching removes repeated work and adds invalidation bugs and staleness. Do not cache data where a user expects to see their own write immediately.
- More instances add CPU for application work. They do not add database capacity, and they multiply connections.
How to verify the fix worked
A single fast request after deploying proves nothing; the queue may simply be empty at that moment. Verify under load:
- The wait queue drains. Pending connection count returns to near zero between bursts instead of growing during them.
- Wait p99 drops toward zero while use time per route stays close to that route's query time.
- Fewer sessions in idle in transaction in
pg_stat_activityat peak. - Health checks stop failing during load, because they no longer queue behind slow handlers.
- Throughput rises before latency does in a load test that steps concurrency up gradually. The knee in the latency curve should move to a higher request rate.
Checklist for Monday
- Add pool wait and pool hold time as separate metrics, tagged by route.
- Set an acquisition timeout below your gateway timeout and map it to 503.
- Find the route with the largest gap between hold time and query time.
- Move any network call out of that route's transaction.
- Give health checks a cheap path that does not depend on the shared pool, or a tiny dedicated pool, so overload does not trigger restarts.
- Compute instances times pool size and compare it to
max_connections. - Load-test pool sizes around the HikariCP starting point and pick the smallest that holds throughput.
Sources
- HikariCP wiki, About Pool Sizing: sizing formula, Oracle demonstration figures, pool-deadlock formula, guidance to test around the baseline.
- HikariCP wiki, Dropwizard Metrics: Wait, Usage, and PendingConnections metrics.
- HikariCP README: connectionTimeout default.
- node-postgres, Pool API: pool counters and connectionTimeoutMillis default.
- OpenTelemetry, database client metrics: connection wait, use, and pending metrics and their stability status.
- PostgreSQL, connection settings: max_connections default and restart requirement.
- PostgreSQL, cumulative statistics system: pg_stat_activity states and columns.
- AWS Lambda, understanding concurrency: concurrency equals requests per second times duration.
- Krishnam Murarka, "Our Database Was at 15% CPU While the API Was Timing Out": public incident write-up of pool wait caused by a connection held across an HTTP call.
Written by
Azeem Subhani
Senior Full-Stack & AI Application Engineer
I build SaaS, booking, payment, real-time, and AI-enabled web platforms with React, Next.js, Node.js, NestJS, Django, PostgreSQL, and AWS. My work includes Stripe payment systems, white-label booking flows, real-time collaboration, RAG workflows, and developer automation.