Android App Startup Time: Measure TTID and TTFD Before You Fix
Name the startup clock first: TTID or TTFD. Measure cold starts with Macrobenchmark, then decide whether profiles or deferred work will actually help.
Azeem Subhani · · 9 min read
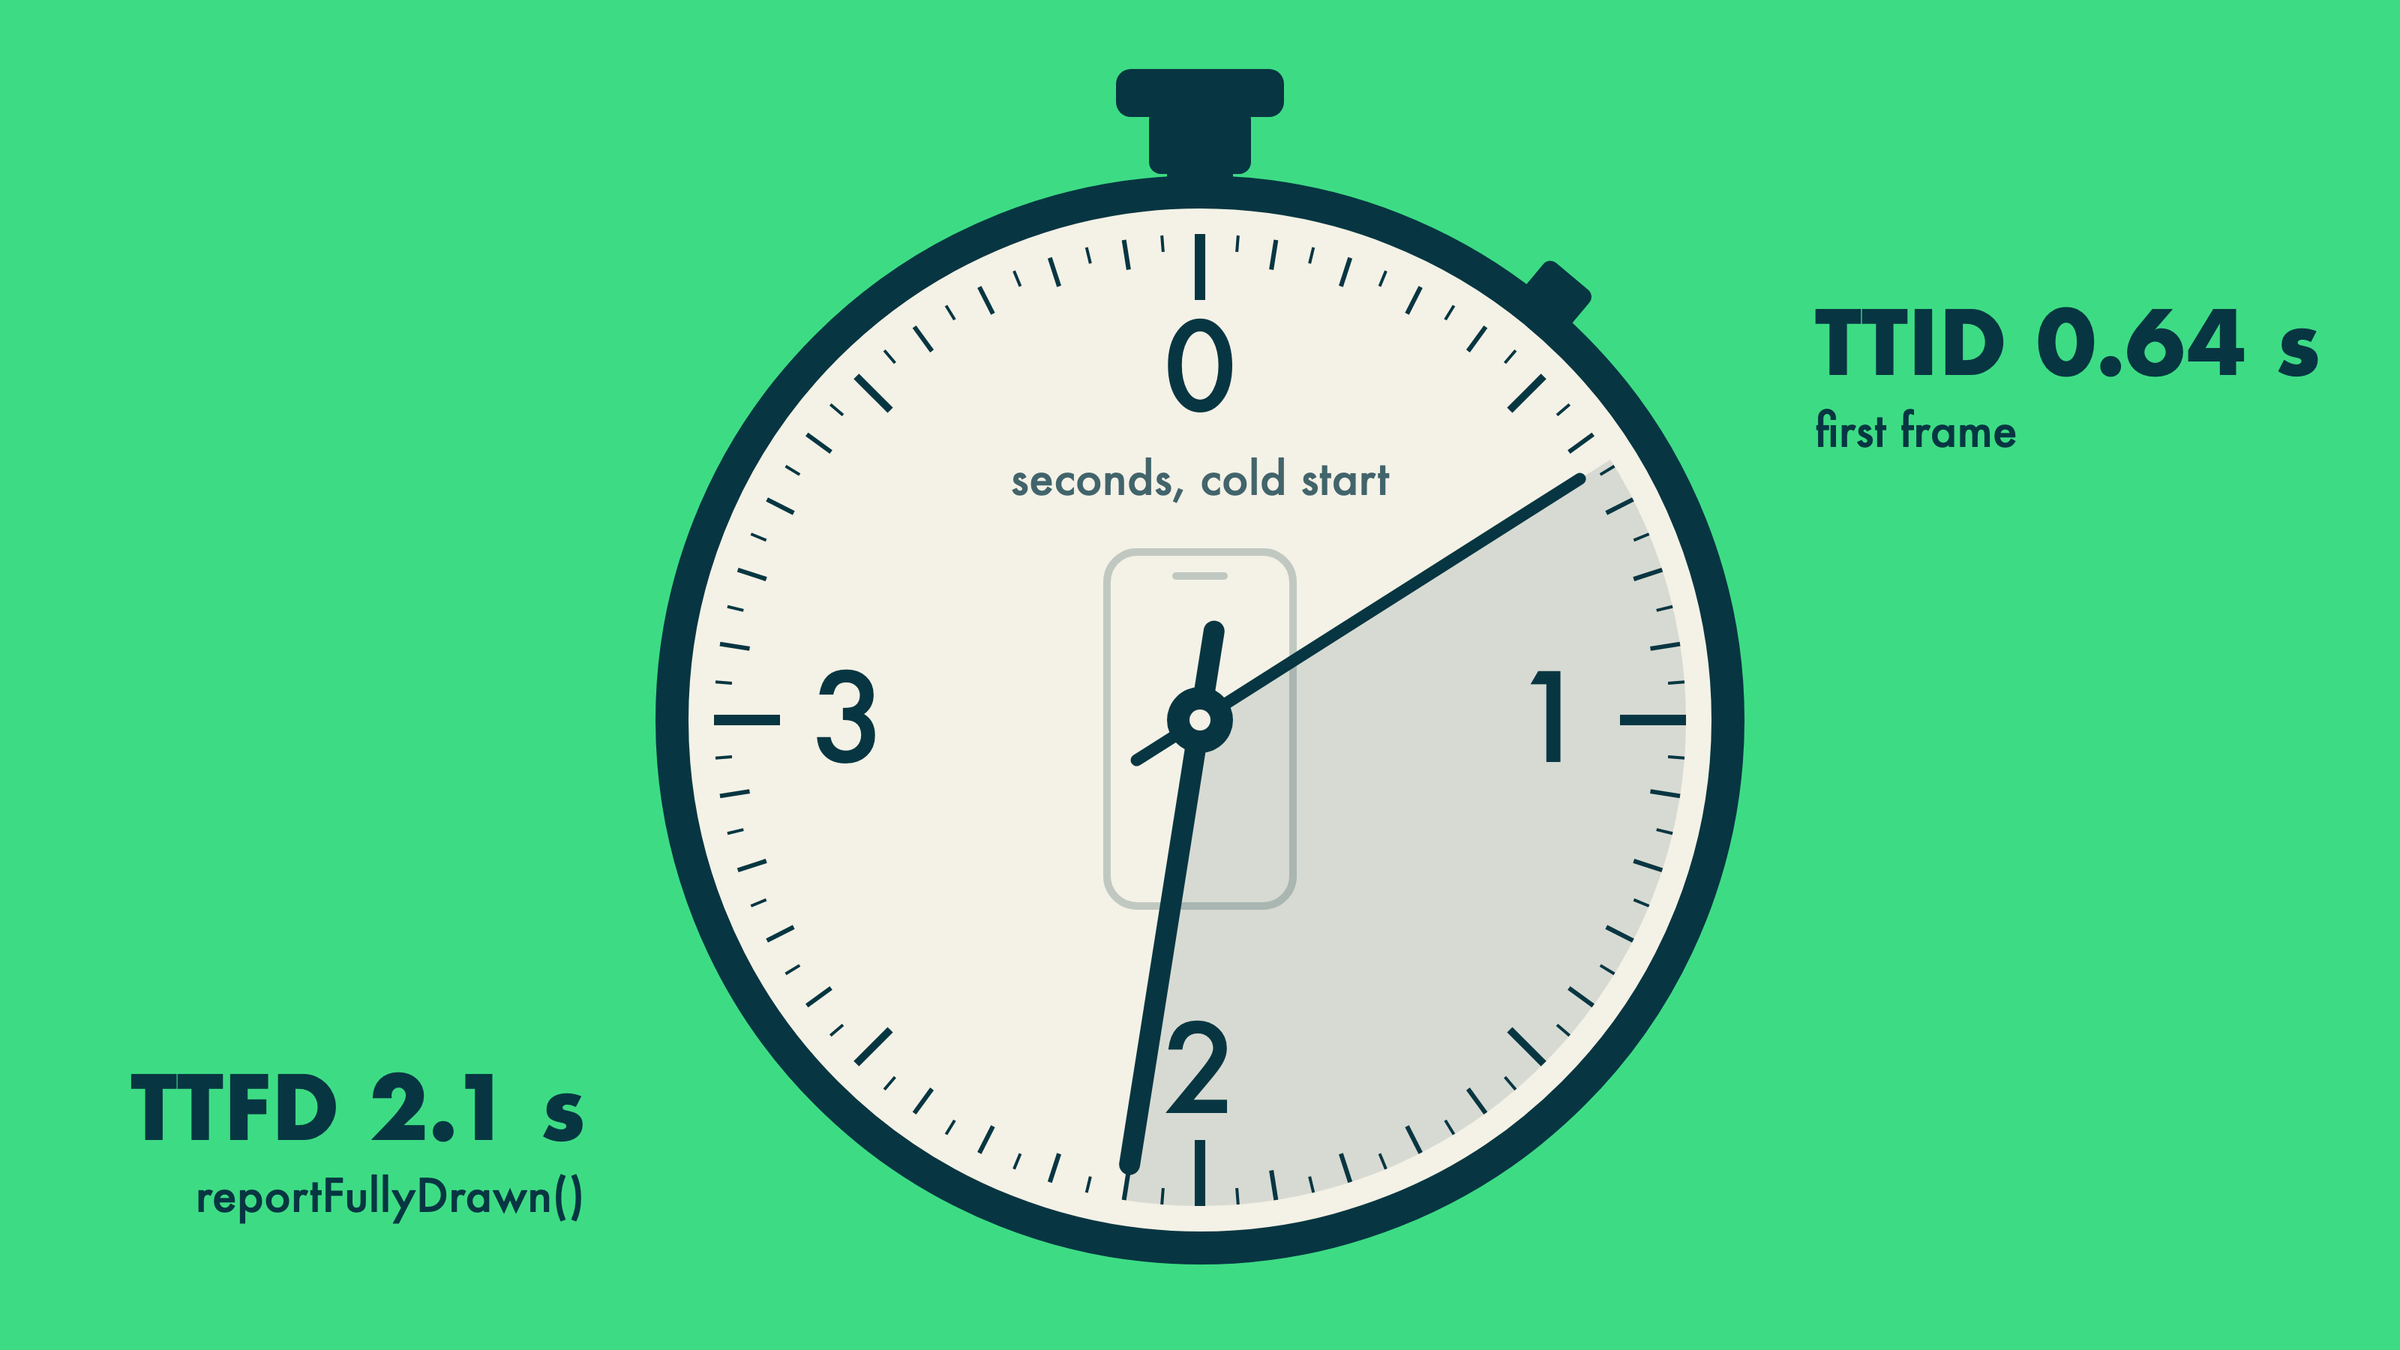
"The app starts slowly" is not a measurement. One engineer means the time until something appears on screen. Another means the time until the first list is loaded and tappable. A third ran a debug build on an emulator and saw a number that no customer will ever experience. Teams then spend a sprint on a splash animation, a library swap, or a network call, and the number they chose to watch barely moves. To improve Android app startup time you first have to say which clock you mean, which kind of start you are timing, and on which build and device. TTID and TTFD are the two clocks Android documents, and they measure different things.
This article covers the definitions, a measurement setup that produces numbers you can trust, the changes that map to each interval, and the point at which Baseline Profiles and Startup Profiles are worth adding. The platform details here follow Android's developer documentation as read in October 2026; tooling versions change, so recheck the linked pages for your Android Gradle Plugin version.
Two clocks: TTID and TTFD
Android's app startup documentation defines two metrics.
- Time to initial display (TTID) is the time until the app renders its first frame. You can read it from the
Displayedline the system writes to Logcat for your activity. - Time to full display (TTFD) is the time until the app is actually usable, including content loaded asynchronously. The system cannot know when that is, so you tell it by calling
reportFullyDrawn(). The system then logs aFully drawnline with the elapsed time.
These can differ by a lot. An app can reach its first frame quickly by showing a skeleton or empty list, then take seconds to fill it. TTID looks great, and the user is still waiting. Conversely, an app that blocks the first frame on a network call has a poor TTID and a TTFD that is barely worse.
So decide which is the target before touching code. The honest answer for most apps is that users judge TTFD, the moment they can act, and TTID is the thing you protect so the app does not look frozen.
Cold, warm, and hot starts are different tests
The same documentation distinguishes three start states:
- Cold start: the process is created from scratch, for example after a reboot or after the system killed the app. It does the most work.
- Warm start: the process exists but the activity must be recreated.
- Hot start: the activity is still in memory and is brought forward. It does the least work.
Android's guidance is to optimize the cold start, since improvements there carry over to the others. That has a measurement consequence: if you launch the app repeatedly from the launcher without killing it, you are timing warm or hot starts, and a cold-start fix will appear to do nothing. Pin the start mode in every comparison.
Measure properly before you change anything
Macrobenchmark is the tool Android provides for this. It drives the app from a separate test module, and its startup metric reports timeToInitialDisplayMs and timeToFullDisplayMs, matching the two clocks above. The documented setup requirements are the ones that make results trustworthy:
- Benchmark a build that resembles production: a non-debuggable, minified variant created from your release configuration, not a debug build.
- Run on a physical device. The documentation states emulator results are unreliable and recommends a device on Android 14 or later for state persistence.
- Choose the start mode explicitly (cold, warm, or hot) and run multiple iterations, then compare distributions instead of a single run.
- Keep the compilation mode in mind. The default mode installs a Baseline Profile if your app has one, which changes what you are measuring.
// Illustrative Macrobenchmark: compare startup with and without ahead-of-time
// compilation of the profiled paths. Runs from a separate com.android.test module.
@LargeTest
@RunWith(AndroidJUnit4::class)
class StartupBenchmark {
    @get:Rule
    val rule = MacrobenchmarkRule()

    @Test
    fun coldStartNoCompilation() = startup(CompilationMode.None())

    @Test
    fun coldStartWithProfile() = startup(CompilationMode.Partial())

    private fun startup(mode: CompilationMode) = rule.measureRepeated(
        packageName = "com.example.app", // placeholder package name
        metrics = listOf(StartupTimingMetric()),
        compilationMode = mode,
        startupMode = StartupMode.COLD,
        iterations = 10,
    ) {
        pressHome()
        startActivityAndWait()
    }
}
For timeToFullDisplayMs to be meaningful, your app has to call reportFullyDrawn() at the right moment. A benchmark of an app that never reports fully drawn can only tell you about the first frame.
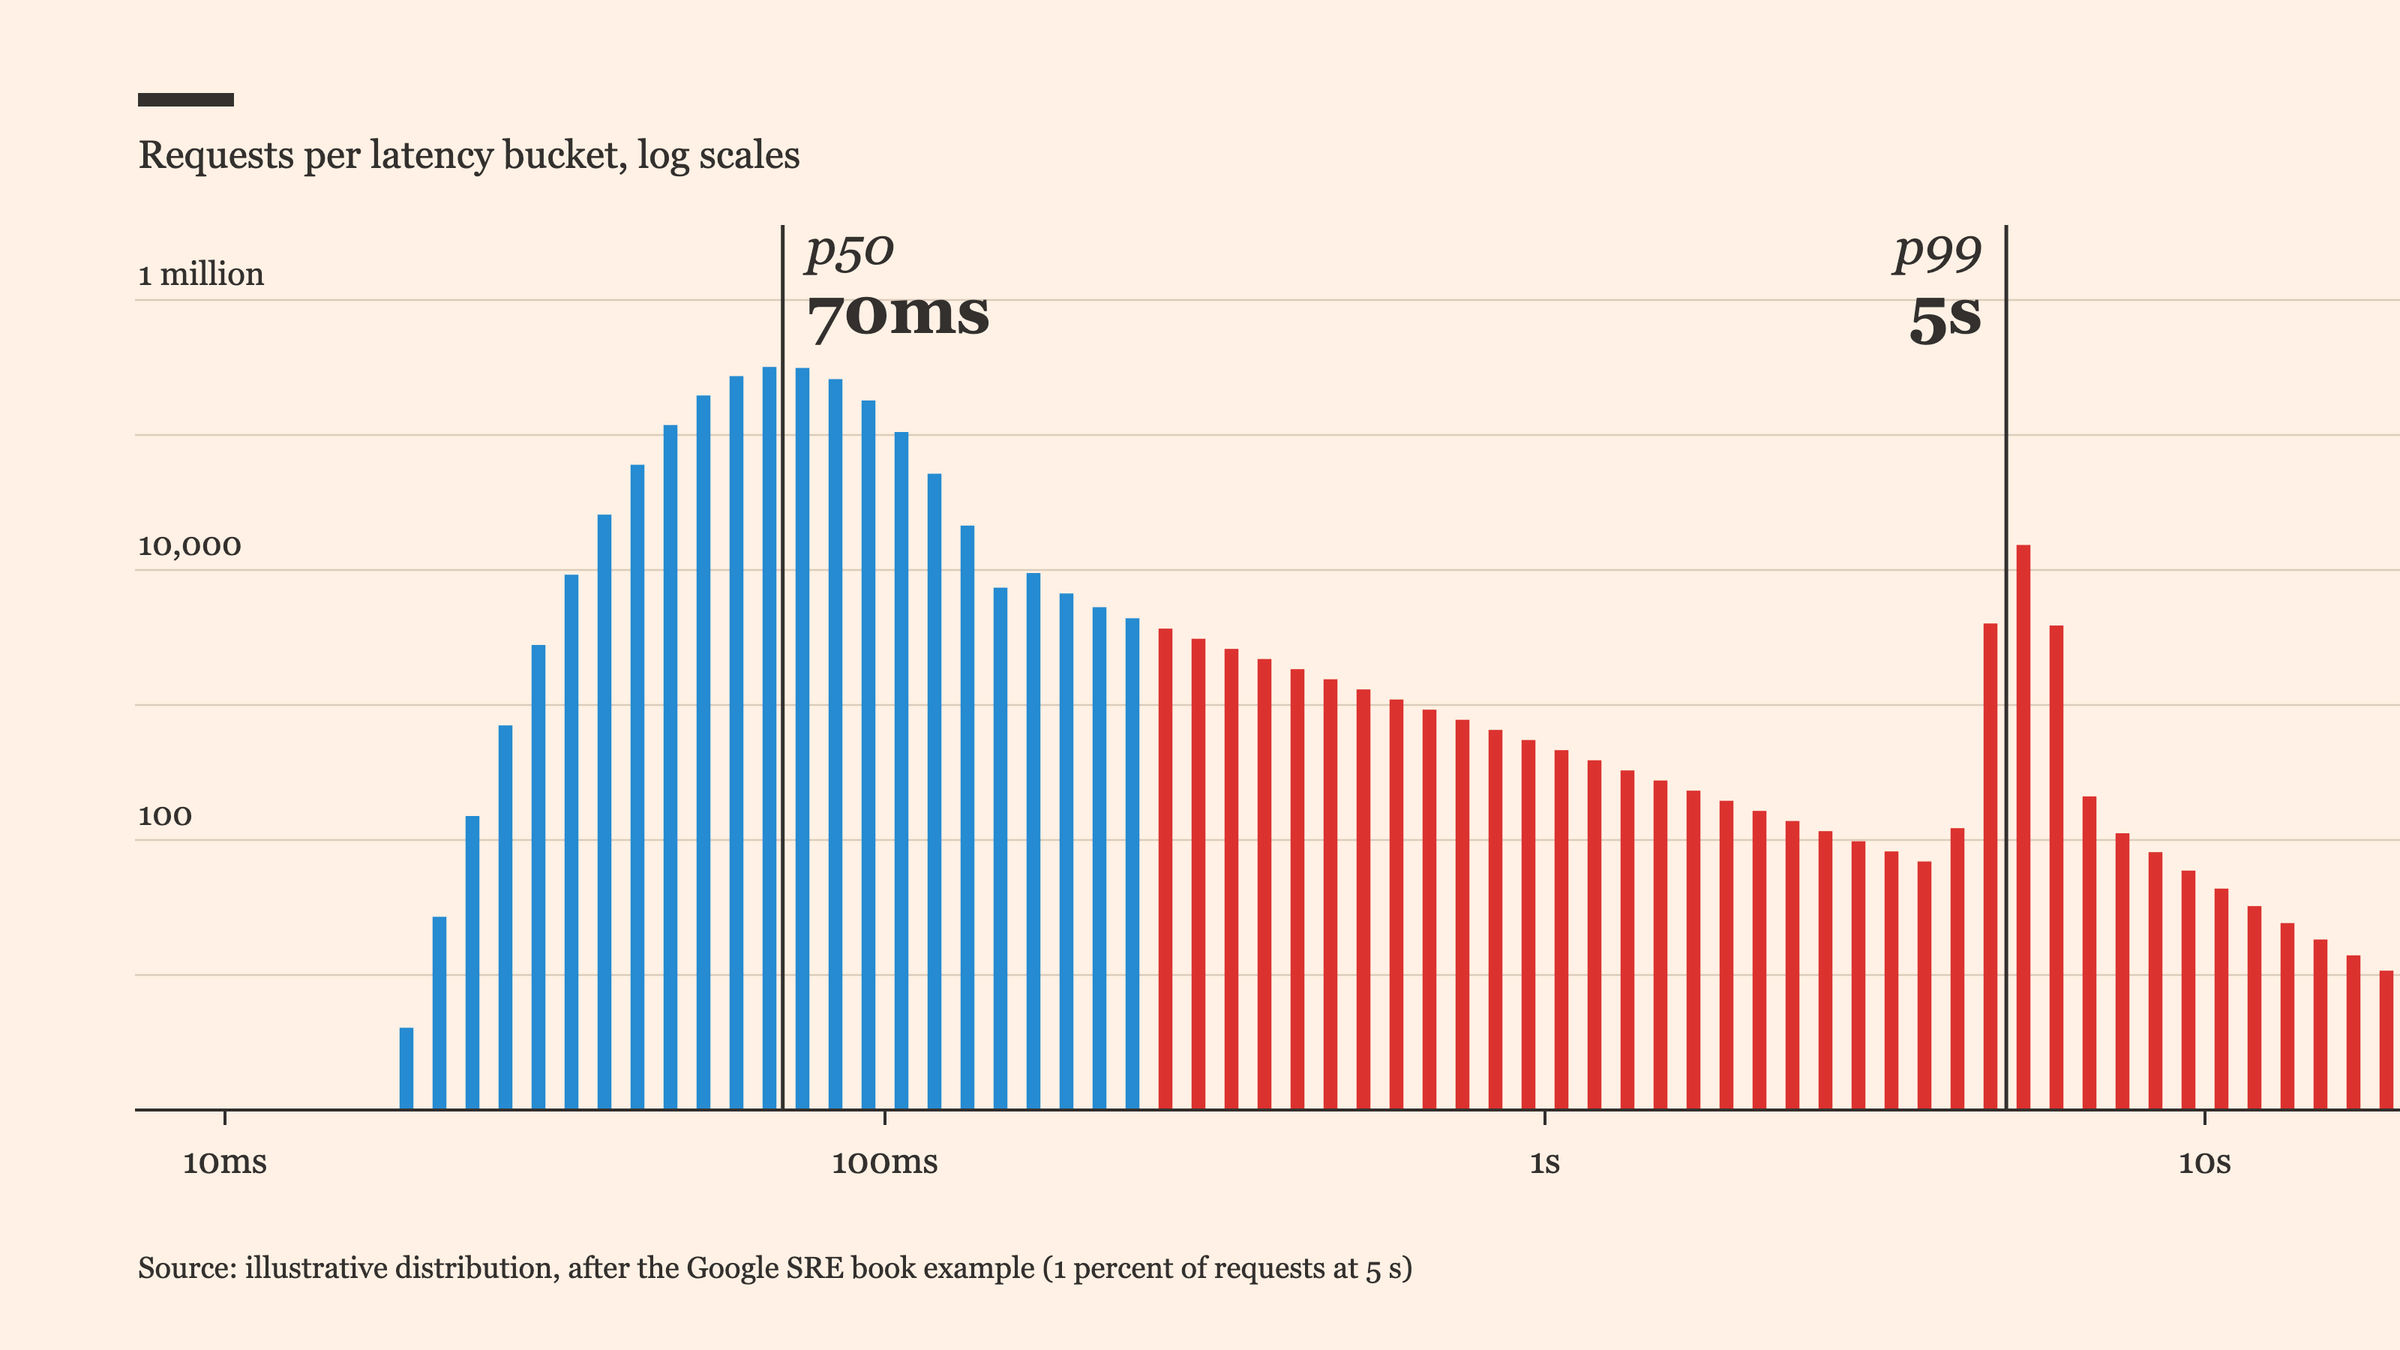
The rest of the discipline is the same as for any percentile-based latency claim: report medians and spread, do not average away the slow runs, and keep the device state constant. For why the slow end matters more than the mean, see p99 tail latency. The same "name the phase, then change that phase" approach applies on the web; see debugging INP with field data.
Report full display at the right moment
Many teams get TTFD wrong by reporting it too early, often when the splash ends or the activity is created. That makes the metric look good and tells you nothing.
// Illustrative: report fully drawn only after real content is on screen.
class FeedActivity : ComponentActivity() {
    private val viewModel: FeedViewModel by viewModels()

    override fun onCreate(savedInstanceState: Bundle?) {
        super.onCreate(savedInstanceState)
        setContent { FeedScreen(viewModel) }

        lifecycleScope.launch {
            // Wait for the first page of real data, not for a placeholder.
            viewModel.firstPageLoaded.first { it }
            reportFullyDrawn()
        }
    }
}
If several things must finish before the screen is usable, Android's documentation points to FullyDrawnReporter, and to the Compose helpers ReportDrawn, ReportDrawnWhen, and ReportDrawnAfter, so each background task can hold the report until it completes.
There is a trade-off in choosing the moment. If you report when the list header is ready but the rows are still loading, TTFD improves on paper while the user still cannot do what they came to do. Define "fully drawn" as the earliest moment the primary action works, write it down, and keep it stable across releases so the trend means something.
Find what is inside the interval
With a stable benchmark, look at where the time goes. Android's startup guidance lists the usual places:
- Heavy Application.onCreate. Eager initialization of SDKs, disk reads, and object graphs that nothing needs yet. The documented fixes are lazy initialization of singletons, the App Startup library instead of per-library content providers, and dependency injection that defers construction.
- Heavy Activity.onCreate. Complex view hierarchies, blocking I/O, and bitmap decoding on the main thread. Flatten the hierarchy, defer non-critical UI, move initialization off the main thread, and show placeholders.
- Custom splash screens. Older patterns such as a dedicated splash activity or disabling the preview window add work. The documentation recommends the platform SplashScreen API with its compatibility library.
To see which one you have, use the tools the documentation names: the CPU profiler on Application.onCreate and activity initialization, android.os.Trace sections around suspect code, and Perfetto traces, where main-thread activity in frame callbacks and Compose phases shows what ran between process start and first frame. Macrobenchmark writes traces you can open in Android Studio or Perfetto, so you can look at the exact run that produced a bad number.
A useful rule while reading the trace: anything on the main thread between process start and the first frame is a candidate to remove, defer, or move. Anything between first frame and your reportFullyDrawn() call is a candidate to start earlier, run in parallel, or shrink.
Where profiles help and where they do not
Android describes Baseline Profiles as a way for the Android Runtime to compile specified code paths ahead of time, so those paths avoid interpretation and just-in-time compilation. Android's documentation states the improvement in code execution speed is about 30 percent from the first launch for the included code paths. Treat that as Android's claim about the mechanism on its reference conditions, not as a prediction for your app. Whether you see anything close depends on how much of your startup time is spent running covered code, and on how well your profile covers the startup journey.
Startup Profiles are a related, compile-time mechanism. They are a subset of the Baseline Profile that the build uses to lay out classes and methods in DEX files so that startup code is grouped together. Android's page describes startup improvements of 15 to 30 percent compared with Baseline Profiles alone. Again, that is the platform documentation's description, and the Baseline Profiles overview mentions an additional gain of about 15 percent in a related context (R8 rewriting of rules with AGP 8.2), which is another reason to measure instead of quoting either number. Startup Profiles require R8 minification in release builds, specific minimum versions of the Android Gradle Plugin and Macrobenchmark, and work best when the startup path stays within a single DEX file.
What profiles do not do is remove work. If the trace shows a long block of SDK initialization on the main thread, a profile may run that code faster but it still runs, and it still delays the first frame. Use the trace to decide:
- Time dominated by interpreted or JIT-compiled execution of your own code on the startup path: a Baseline Profile is a good candidate.
- Time that looks like code layout or page-in effects across large DEX files: a Startup Profile is a candidate.
- Time that is a blocking network call, disk read, or eager initialization: remove or defer the work first.
The documented limits are worth knowing before you commit. Google Play delivers the profile with the APK, but other install channels do not apply profiles at install, so benefits may arrive later through background optimization. Internal App Sharing is not supported for this purpose; the documentation suggests an internal testing track. The overview also lists a size cap of 1.5 MB on the profile. Generating profiles is a build-pipeline commitment: it needs a generator module, a device or emulator in CI, and regeneration when the startup path changes.
To confirm a profile helped on your binary, run the benchmark above with CompilationMode.None() and with CompilationMode.Partial() on a physical device, cold start, many iterations, and compare the distributions. If the two overlap, the profile is not your bottleneck.
Trade-offs to decide explicitly
- Optimizing the first frame can leave an empty first screen. A fast TTID with a skeleton makes the app look alive, but if the real content takes just as long, the user's wait is unchanged. It is still worth it when it prevents the app from looking hung.
- Optimizing TTFD is what users mean, and it can need product cuts. Getting the primary action ready sooner may mean fetching less, caching the last screen, or dropping a feature from the launch path. Those are product decisions, not engineering ones.
- A splash screen hides a slow start from a casual metric, not from the person holding the phone. If a splash keeps the app on screen longer, TTID may look fine while perceived wait grows.
- Lazy initialization moves cost. Deferring an SDK to first use can make the first screen that uses it slower or jankier. Check that you moved the cost off the critical path instead of onto the next interaction.
- Profiles add build complexity. They can drift out of date as the startup path changes. Budget for regenerating them, and keep the benchmark in CI so a regression shows up.
- Benchmarks cost device time. Physical devices, many iterations, and cold starts are slow to run. A nightly job on a small device pool is usually the realistic compromise.
The debug-versus-release gap deserves its own article, but the short version is this: never use debug build numbers to justify or reject a startup change.
Checklist for Monday
- Write down the target: TTID, TTFD, or both, and the start mode (cold first).
- Define the exact moment the app is "fully drawn" and call
reportFullyDrawn()there. - Add a Macrobenchmark with a release-like variant, a physical device, and many iterations.
- Capture a trace for a median run and a slow run, and list the main-thread work before first frame.
- Remove or defer the largest item, then rerun the same benchmark.
- Add a Baseline Profile only if the trace shows time in interpreted or JIT-compiled code on the startup path, and verify with and without compilation.
- Keep the benchmark in CI and track the distribution over releases.
Sources
- App startup time, Android Developers: cold, warm, and hot starts; TTID and TTFD;
reportFullyDrawn; common bottlenecks and diagnosis tools. - Macrobenchmark overview, Android Developers: startup metrics, benchmark variant, physical device guidance, startup modes, compilation modes.
- Baseline Profiles overview, Android Developers: mechanism, the roughly 30 percent figure, Play delivery, limits.
- Create Startup Profiles, Android Developers: DEX layout optimization, the 15 to 30 percent figure, requirements.
Written by
Azeem Subhani
Senior Full-Stack & AI Application Engineer
I build SaaS, booking, payment, real-time, and AI-enabled web platforms with React, Next.js, Node.js, NestJS, Django, PostgreSQL, and AWS. My work includes Stripe payment systems, white-label booking flows, real-time collaboration, RAG workflows, and developer automation.