Debug Poor INP: Find the Slow Phase in Real User Data
Lab scores look fine but taps feel late. Split INP into input delay, processing, and presentation delay, reproduce it, and verify the fix in field data.
Azeem Subhani · · 9 min read
Lighthouse reports a green performance score, the Core Web Vitals report says INP is "needs improvement," and a customer says the Add to Cart button "does nothing for a second." The tempting conclusion is that the field data is noisy or that the lab score is the truth. Both readings are wrong in the same way: Interaction to Next Paint (INP) is measured on real interactions, on real devices, at whatever moment the user happened to tap. A default lab run loads the page and stops. It never taps the button while a third-party script is still compiling. If you need to debug poor INP, the job is to find the one slow interaction, name which phase of it was slow, and change that phase.
This article gives a procedure for doing that, the fixes that map to each phase, and the ways each fix can backfire.
Debug poor INP: what it measures and why Lighthouse misses it
web.dev defines INP as the latency of clicks, taps, and key presses across a whole page visit, reported as a single value near the worst interaction. Scrolling, hovering, and zooming are excluded. At the 75th percentile of page loads, 200 ms or less is good, 201 to 500 ms needs improvement, and over 500 ms is poor. Those thresholds are the ones web.dev publishes at the time of writing, so check the page if you are reading this much later.
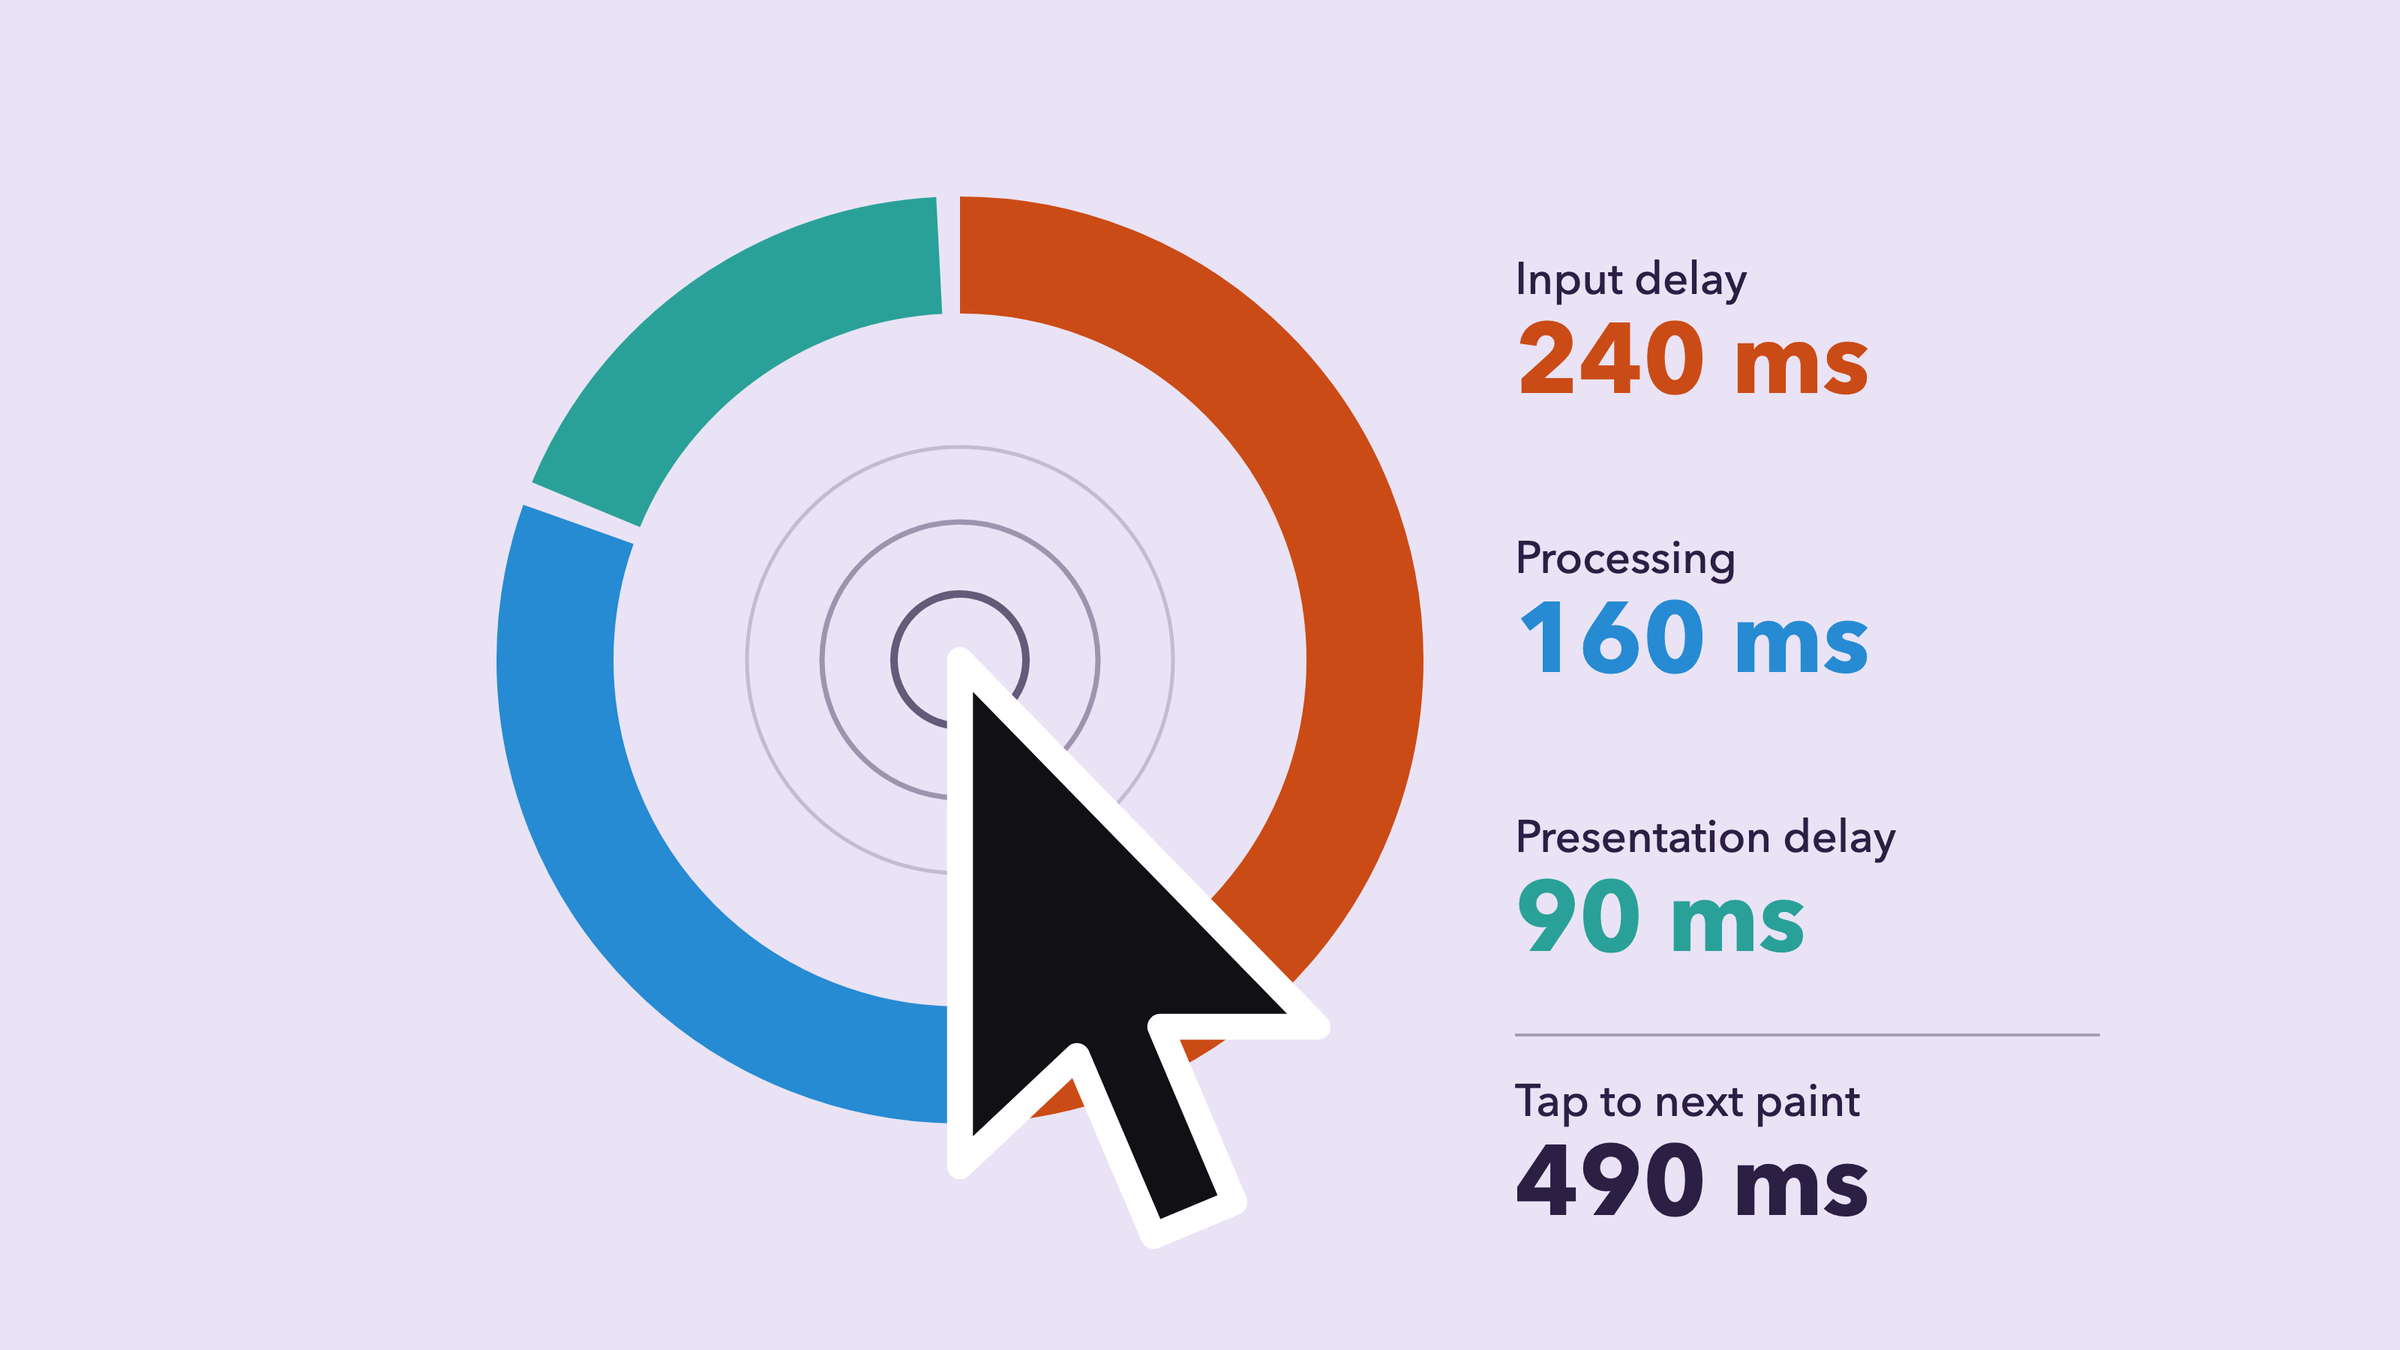
Each interaction has three phases, and every fix you will ever apply targets exactly one of them:
- Input delay: the time between the user's input and the first event handler starting. The main thread was busy with something else.
- Processing duration: the time your event callbacks run.
- Presentation delay: the time from the handlers finishing to the next frame being painted.
web.dev's guidance is explicit that field data tells you which interaction is slow but not why, while lab testing helps you reproduce and diagnose but can miss the interactions real users perform. That asymmetry is the whole method: use the field to pick the target, use the lab to reproduce it, and use the field again to confirm the change.
The same discipline of naming the clock before optimizing applies to other platforms, for example Android startup, where "slow" means two different intervals.
Step one: get phase-level attribution from real users
Without a real user monitoring (RUM) provider, you can still collect attribution yourself. The web-vitals attribution build exposes the interaction target as a CSS selector, the three phase durations, and the Long Animation Frames (LoAF) entries that overlapped the interaction.
// Illustrative field collection for INP attribution.
import { onINP } from 'web-vitals/attribution';

onINP((metric) => {
  const { interactionTarget, inputDelay, processingDuration, presentationDelay } =
    metric.attribution;

  // The last LoAF entry is the frame most likely to contain the slow work.
  const loaf = metric.attribution.longAnimationFrameEntries.at(-1);
  const worstScript = loaf?.scripts
    ?.slice()
    .sort((a, b) => b.duration - a.duration)[0];

  const body = JSON.stringify({
    value: metric.value,
    rating: metric.rating,
    target: interactionTarget,
    inputDelay,
    processingDuration,
    presentationDelay,
    // Keep script attribution coarse: type and source, not full URLs with tokens.
    invokerType: worstScript?.invokerType,
    sourceFunctionName: worstScript?.sourceFunctionName,
  });

  // sendBeacon survives page unload, which is when INP is often finalized.
  navigator.sendBeacon('/rum/inp', body);
});
Two cautions on this snippet. First, selectors and URLs can contain identifiers or query strings, so scrub them before they leave the browser. Second, if you turn the selector into a metric label, you can create a very large number of time series; see metric cardinality before doing that. Store attribution as log-style events and aggregate offline instead.
What the LoAF fields can and cannot prove
The Long Animation Frames API reports frames whose rendering was delayed beyond 50 ms. Each script entry carries an invoker, an invoker type (such as event listener, user callback, classic script, module script, or promise resolution), a source URL, a function name, and a character position. That is enough to name a script and often a function. Its documented limits matter for diagnosis:
- It is available in Chrome and Edge 123 and later, not in Firefox or Safari, so your attribution describes only part of your audience.
- Cross-origin iframes, workers, and service workers are not covered, so a slow interaction whose cause lives there will show up as a long frame with thin script detail.
- It tells you what occupied the frame. It does not tell you whether that work was necessary.
Treat LoAF output as a strong lead and a way to choose where to point the profiler, not as a verdict.
Step two: read the phase split
Sort your attribution by the dominant phase. Each pattern points to a different class of cause, per web.dev's INP optimization guidance:
- Large input delay: something else held the main thread. web.dev lists script parsing, compilation, and evaluation, long tasks during load, and competing interactions. In LoAF data this often appears as a classic-script or module-script invoker, or a timer or promise callback, that started before the user tapped.
- Large processing duration: your handler did too much. Look for synchronous loops, state updates that fan out, and layout thrashing (writing styles and then reading layout in the same task).
- Large presentation delay: the handler finished quickly but the browser needed a long time to produce the next frame. Large DOM size, expensive style recalculation, and large HTML rendered from JavaScript are the usual suspects, and web.dev suggests
content-visibilityfor offscreen content as one mitigation.
Do not edit anything until you can write down a sentence of the form "on this selector, at the 75th percentile, phase X dominates, and the invoker is Y." A fix that cannot be traced to a phase is a guess.
Step three: reproduce one slow interaction in DevTools
Pick the selector with the worst phase and reproduce it locally.
- Open the Performance panel and, in capture settings, set CPU throttling. The DevTools reference describes throttling as relative to your machine, so a strong slowdown setting on a fast laptop is a rough stand-in for a mid-range phone, not a measurement of one.
- Record, then interact the way the field data suggests. web.dev advises interacting during page load, when the main thread is most congested, because that is where input delay hides.
- Find the interaction in the Interactions track. DevTools shows the input delay, processing time, and presentation delay segments, and flags interactions over 200 ms.
- Compare the phase split to the field attribution. If your local trace shows a different dominant phase than your users, your reproduction is wrong, not the field data. Adjust throttling or the moment of interaction until they agree.
If you cannot reproduce it at all, say so in the ticket. That outcome is useful: it means the cause likely depends on a third-party script, a device class, or a state you have not recreated, and it argues for collecting more attribution rather than guessing.
Fixes by phase
Input delay: stop occupying the thread
If the invoker is a script that ran before the tap, the lever is when and whether that script runs, not how your handler is written. Defer non-critical scripts, split large evaluation across tasks, and remove work that does not need to happen during load. If the offender is a third-party tag, the conversation is about loading it later or removing it, and that deserves its own review with the tag owner rather than a general "reduce JavaScript" ticket.
Processing duration: do less, then yield
First, do less. Moving work out of the handler or skipping it entirely improves both responsiveness and total time. Only after that, yield so the browser can paint and handle input between chunks.
Chrome's guidance on scheduler.yield() explains why it is preferable to the old setTimeout(0) trick: a setTimeout continuation goes to the back of the task queue behind other queued work, whereas a scheduler.yield() continuation is given a higher priority than starting other tasks. MDN describes the same behavior as a boosted priority queue where continuations run before same-priority postTask() tasks.
Support is the catch. Chrome's article lists Chrome and Edge 129 and later, with partial Firefox support and none in Safari. MDN marks it as limited availability, not Baseline. Verify against the current compatibility table before you rely on it, and ship a fallback.
// Illustrative: yield with a fallback for browsers without scheduler.yield().
type SchedulerLike = { yield?: () => Promise<void> };

function yieldToMain(): Promise<void> {
  const scheduler = (globalThis as { scheduler?: SchedulerLike }).scheduler;
  if (scheduler?.yield) {
    return scheduler.yield();
  }
  // Fallback: the continuation queues behind other pending tasks.
  return new Promise((resolve) => setTimeout(resolve, 0));
}

async function onApplyFilters(items: Item[]) {
  // Immediate feedback first, so the next paint reflects the click.
  showSpinner();
  await yieldToMain();

  const results: Row[] = [];
  for (let i = 0; i < items.length; i++) {
    results.push(expensiveTransform(items[i]));
    // Yield periodically so input can run between chunks.
    if (i % 50 === 49) await yieldToMain();
  }
  renderRows(results);
}
The shape matters more than the helper. Do the work the user needs to see (a spinner, a pressed state, optimistic UI), yield, then do the rest. web.dev's own example updates the UI first, then schedules lower-priority work such as word counts and saving in a later task.
Presentation delay: reduce what the next frame must do
If handlers are fast and frames are slow, yielding will not help, because the cost is in style, layout, and paint. Reduce DOM size, render offscreen content lazily, avoid forcing synchronous layout inside handlers, and avoid injecting large HTML strings from JavaScript when server rendering could deliver it.
Trade-offs and when a fix backfires
- Yielding can make the whole job finish later. Every yield gives other tasks a turn. INP improves because the next paint is no longer blocked, but a user waiting for the final result waits longer. Doing less work improves both numbers; yielding only trades one for the other.
- A debounce can hide the delay from the metric and from the user. If the visible change happens after a debounce timer, the next paint after the tap may show nothing new, which can lower the measured latency without making the interface feel faster. Make sure the first paint after the interaction shows meaningful feedback.
- Delaying analytics and other third-party work loses early events. Deferring a tag until after load means clicks and views in the first seconds go unrecorded unless you buffer them. Decide which loss is acceptable.
- Fallbacks change behavior. In browsers without
scheduler.yield(), thesetTimeoutfallback can let other queued work run before your continuation. Test the fallback path, not just Chrome. - Throttled labs are approximations. CPU throttling multiplies your machine's speed; it does not model a specific phone's memory pressure, thermal limits, or other apps.
Confirm the change against field data
A single lab run going from red to green does not confirm anything, because lab runs rarely contain the problematic interaction in the first place. To verify:
- Re-run the DevTools reproduction and confirm the targeted phase shrank in the Interactions track.
- Ship behind a flag or to a slice of traffic if you can, and compare the same selector's phase attribution before and after.
- Watch the field INP at the 75th percentile, segmented by mobile and desktop, as web.dev recommends. Aggregated field data such as CrUX is slower to reflect a change than your own per-interaction beacon, so judge the fix by the beacon first and the aggregate later.
- Check that the next-worst interaction did not simply become the new INP. INP reports roughly the worst interaction, so fixing one reveals the next.
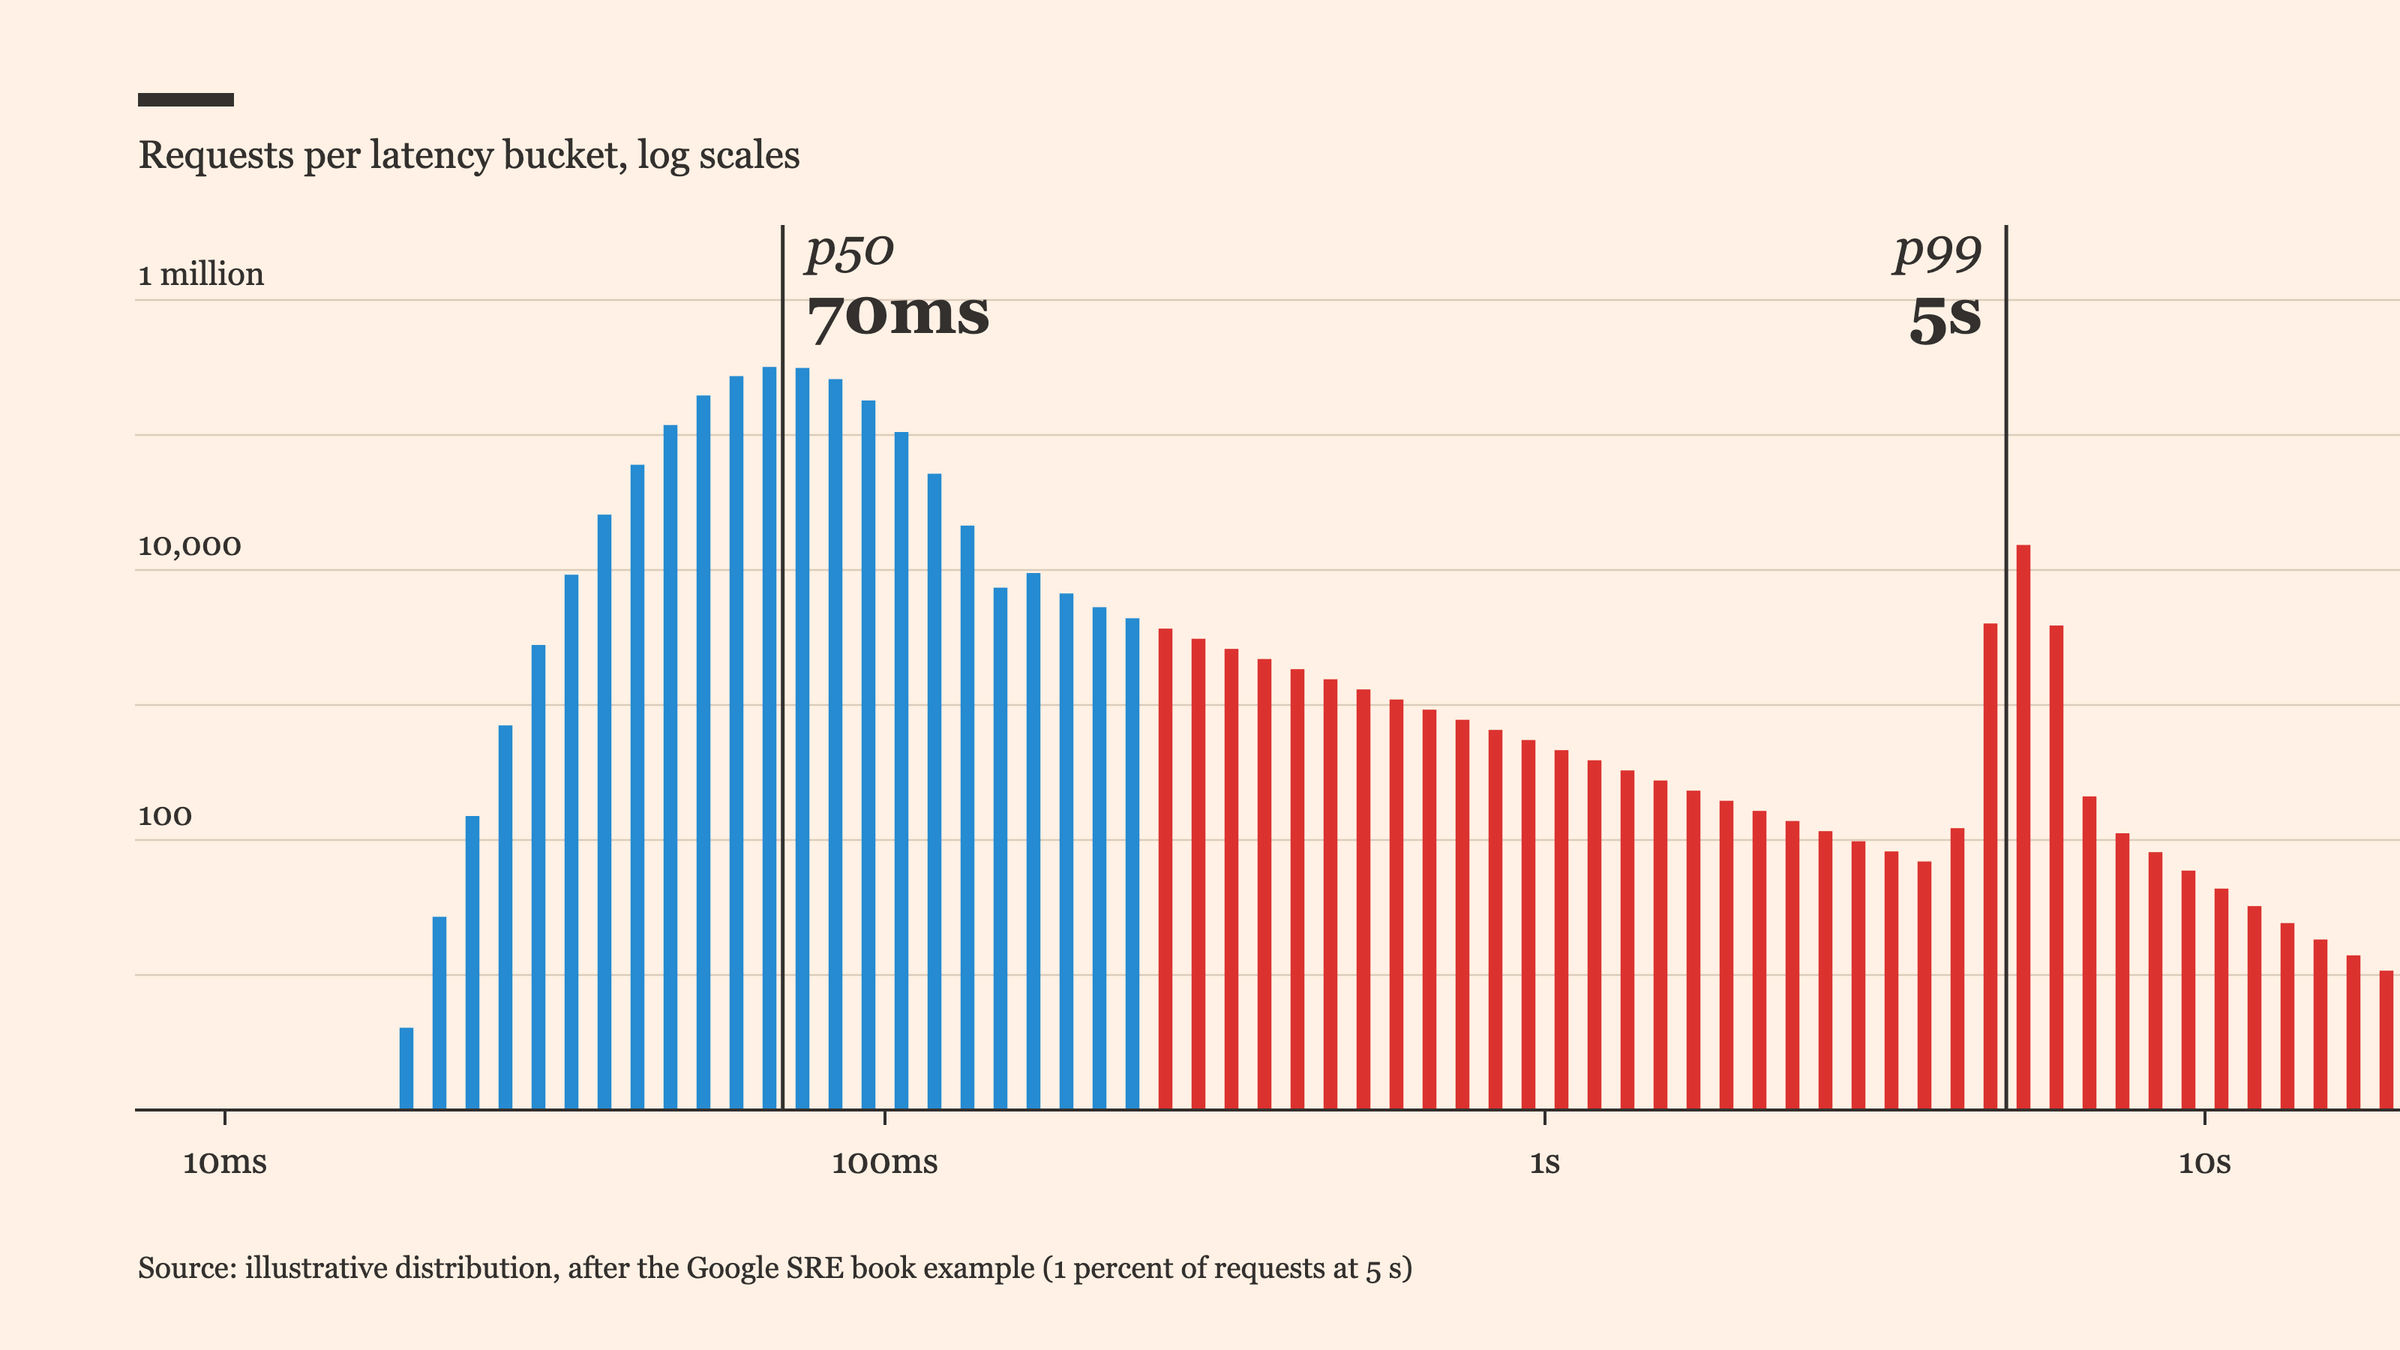
For how to read percentile-based latency without fooling yourself, see p99 tail latency.
Checklist for Monday
- Collect INP attribution with selector, three phase durations, and LoAF script info, with URLs scrubbed.
- Rank selectors by their 75th percentile INP and pick one.
- Write the sentence: selector, dominant phase, invoker.
- Reproduce it with CPU throttling during page load, and match the phase split.
- Apply one fix per phase: defer or remove blocking scripts, do less in the handler and then yield, or shrink rendering work.
- Ship a
scheduler.yield()fallback and test it. - Compare per-selector attribution before and after, then watch the aggregate.
Sources
- Interaction to Next Paint (INP), web.dev: definition, thresholds, three phases, field versus lab guidance.
- Optimize Interaction to Next Paint, web.dev: causes and fixes per phase, yielding, layout thrashing, DOM size.
- Find slow interactions in the field, web.dev: web-vitals attribution build and LoAF fields.
- Long Animation Frames API, Chrome for Developers: 50 ms threshold, script attribution, support and limits.
- Use scheduler.yield() to break up long tasks, Chrome for Developers: priority versus
setTimeout, support status. - Scheduler.yield(), MDN: limited availability, priority behavior.
- Performance features reference, Chrome DevTools: CPU throttling and the Interactions track.
Written by
Azeem Subhani
Senior Full-Stack & AI Application Engineer
I build SaaS, booking, payment, real-time, and AI-enabled web platforms with React, Next.js, Node.js, NestJS, Django, PostgreSQL, and AWS. My work includes Stripe payment systems, white-label booking flows, real-time collaboration, RAG workflows, and developer automation.